Copyright
©2012 Baishideng Publishing Group Co.
World J Gastroenterol. Mar 28, 2012; 18(12): 1397-1403
Published online Mar 28, 2012. doi: 10.3748/wjg.v18.i12.1397
Published online Mar 28, 2012. doi: 10.3748/wjg.v18.i12.1397
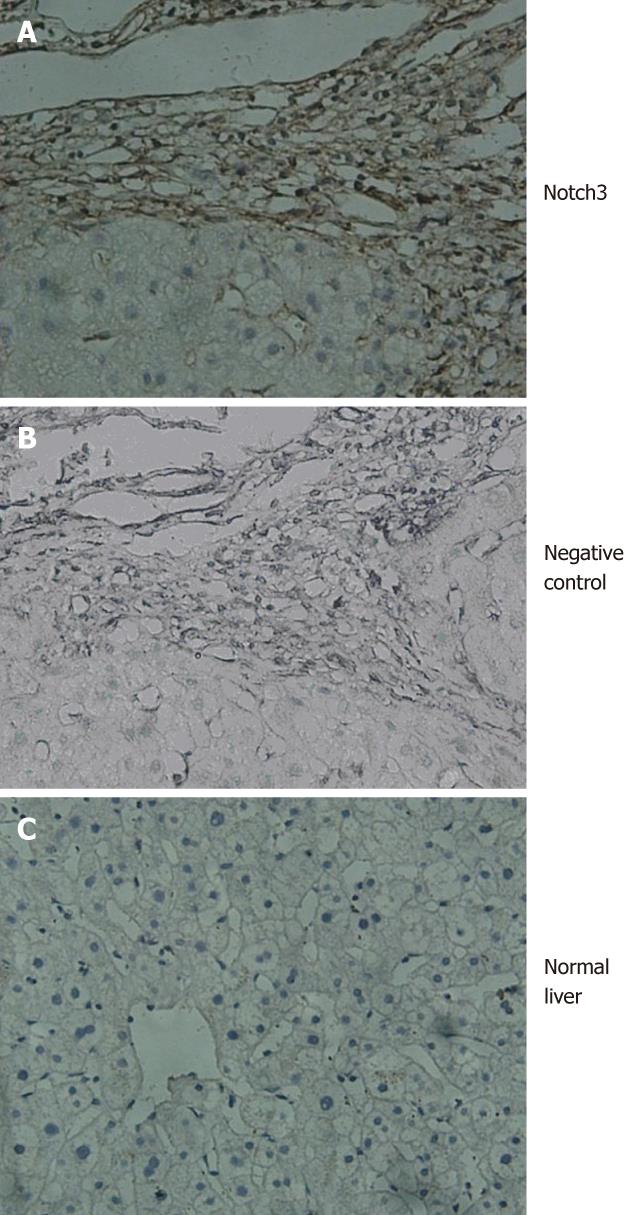
Figure 1 Immunohistochemical staining of Notch3 in liver tissues of patients with chronic active hepatitis and normal livers.
A: Intense staining of Notch3 in fibrotic tissues of livers from patients with chronic active hepatitis; B: Negative control; C: Notch3 was not detected in normal liver tissues (x 400).
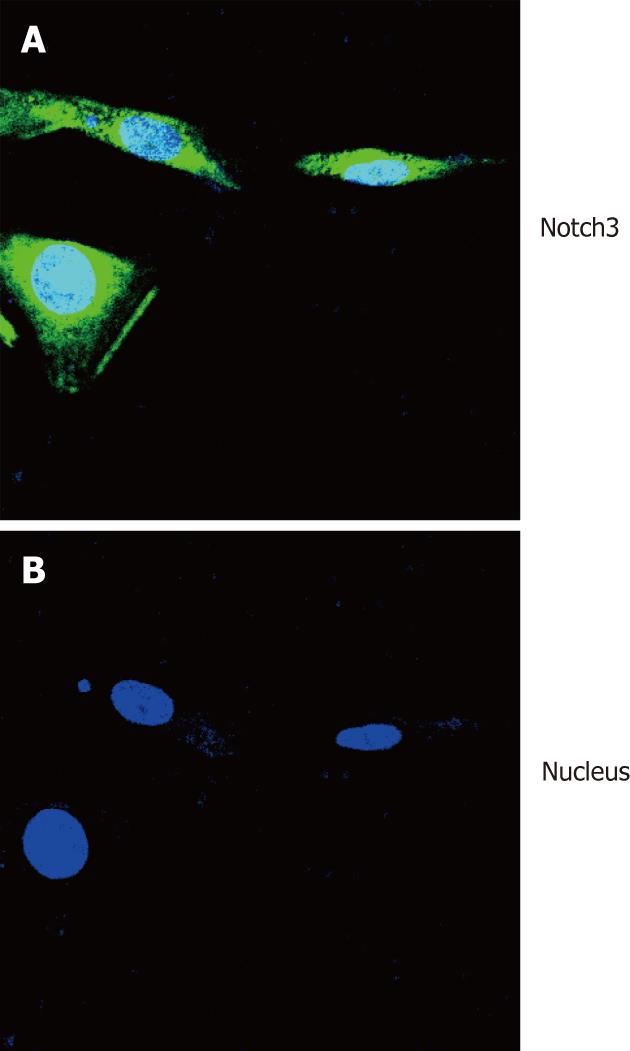
Figure 2 Immunofluorescence staining analysis was performed to examine expression of Notch3 in hepatic stellate cell-T6 cells.
A: The green fluorescence represents the expression of Notch3; B: Blue one represents nucleus of hepatic stellate cell-T6 cells (x 400).
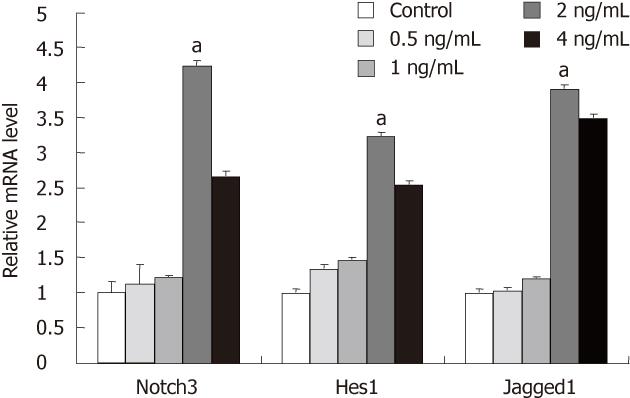
Figure 3 TaqMan reverse transcription polymerase chain reaction analysis was performed to detect expression of Notch3, Jagged1 and Hes1 in hepatic stellate cell-T6 cells treated or not with transforming growth factor-β1 (0.
5, 1, 2 and 4 ng/mL) for 24 h. aP < 0.05 vs control group.
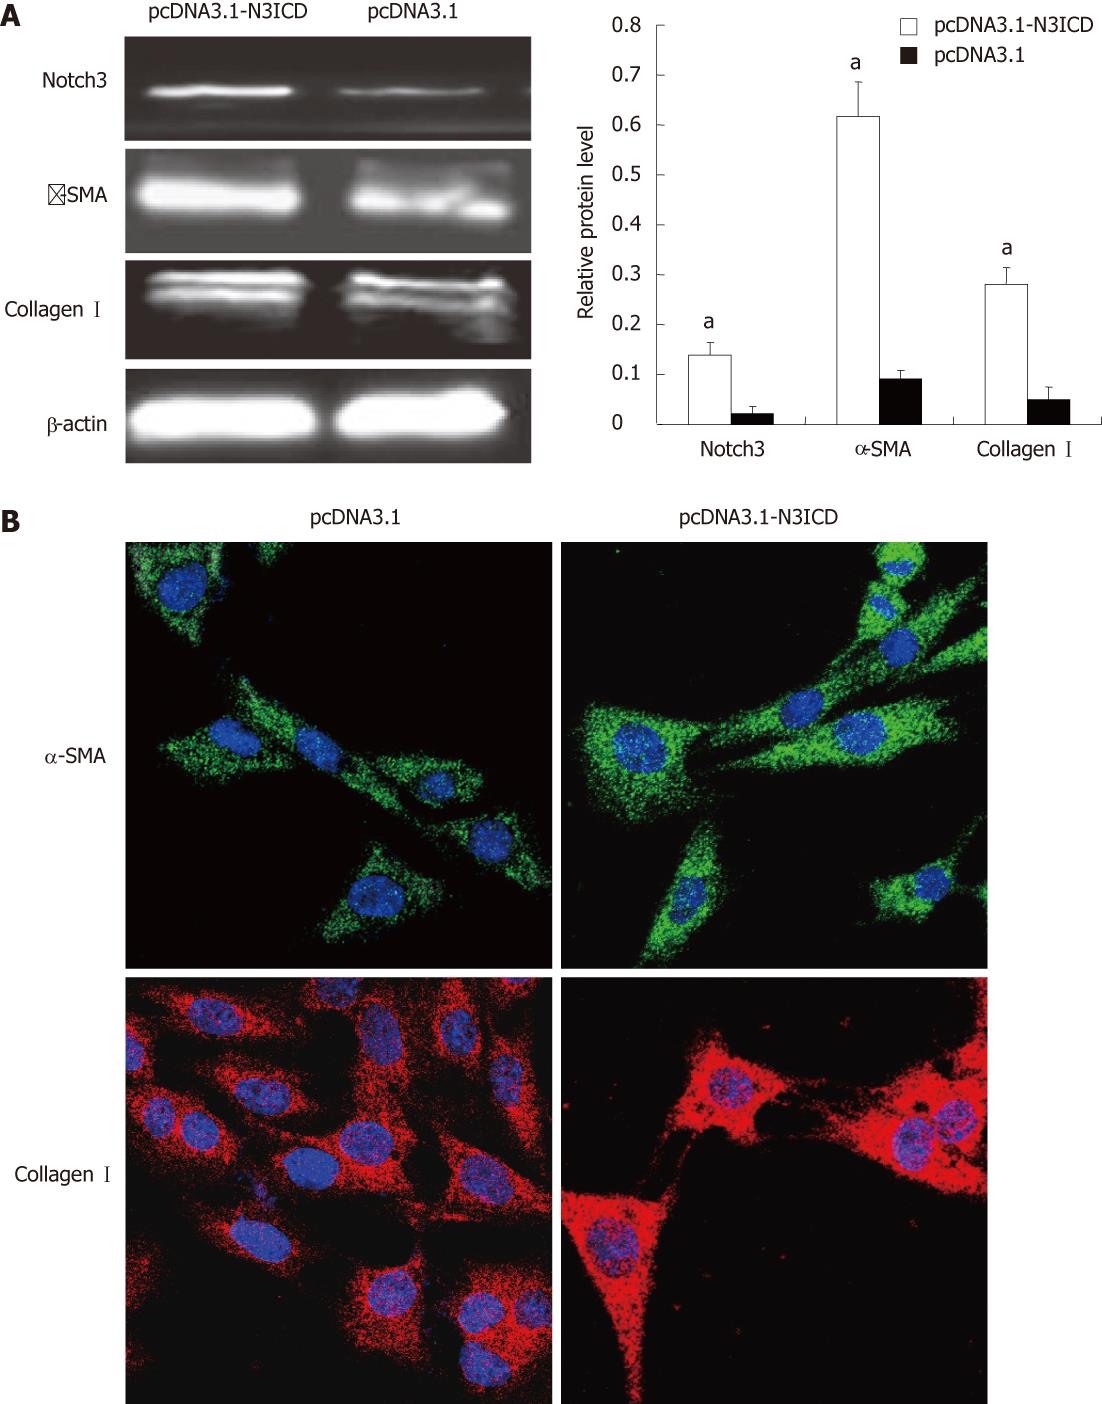
Figure 4 Over-expression of Notch3 intracellular domain increased the expression of myofibroblastic marker in hepatic stellate cell-T6.
A: The expression of Notch3, α-smooth muscle actin (SMA) and collagen I were detected by Western blotting. Graphic representation of relative level of Notch3, α-SMA and collagen I normalized to β-actin; B: The expression of α-SMA and collagen I was also detected by immunofluorescence staining (x 400), aP < 0.05 vs control group.
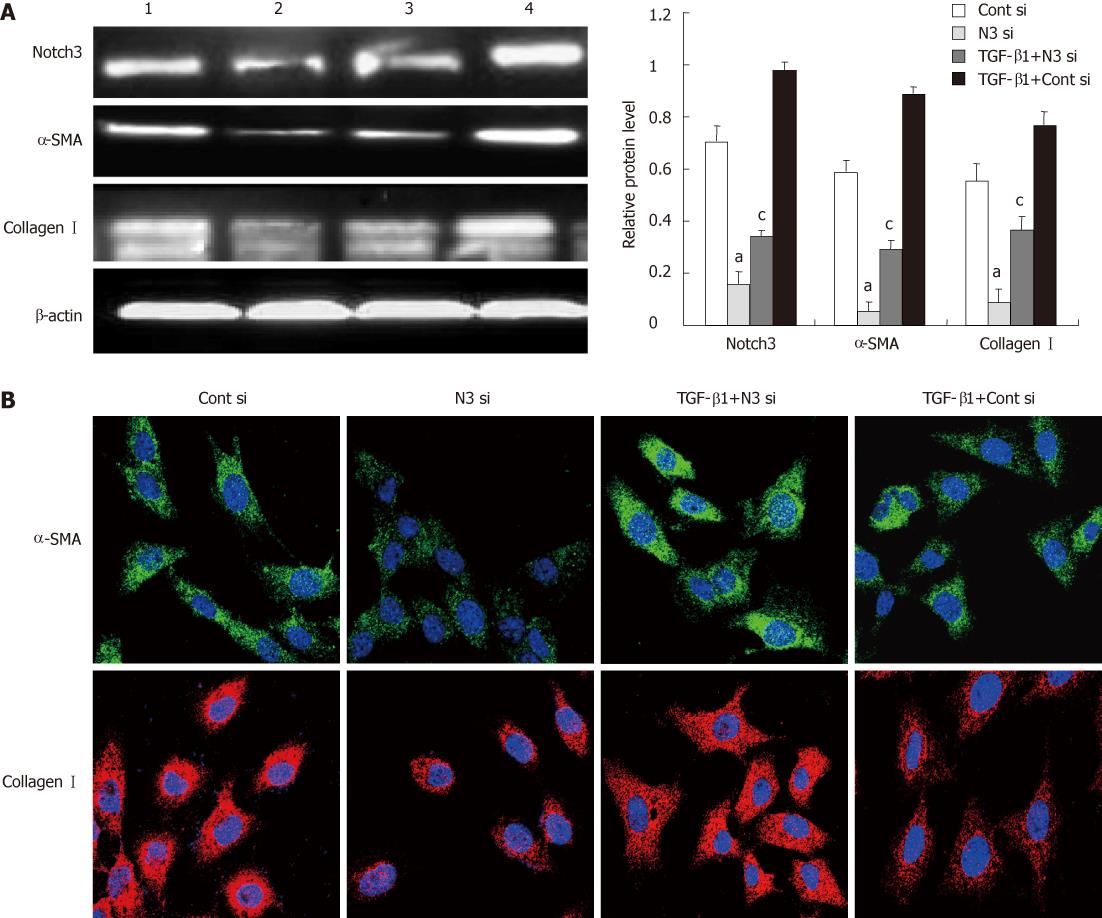
Figure 5 Knockdown of Notch3 decreased the secretion of myofibroblastic marker in hepatic stellate cell-T6.
A: Effects of Notch3 knockdown in HSC-T6 using Notch3 siRNA (N3 si), and control siRNA (Cont si) were investigated. Expression of Notch3, α-smooth muscle actin (SMA) and collagen I was detected by Western blotting. Graphic representation of relative level of Notch3, α-SMA and collagen I normalized to β-actin; B: The expression of α-SMA and collagen I was also detected by immunofluorescence staining (x 400). aP < 0.05 vs control siRNA group, cP < 0.05 vs transforming growth factor (TGF)-β1+control siRNA group. 1: Cont si; 2: N3 si; 3: TGF-β1+N3 si; 4: TGF-β1+Cont si.
- Citation: Chen YX, Weng ZH, Zhang SL. Notch3 regulates the activation of hepatic stellate cells. World J Gastroenterol 2012; 18(12): 1397-1403
- URL: https://www.wjgnet.com/1007-9327/full/v18/i12/1397.htm
- DOI: https://dx.doi.org/10.3748/wjg.v18.i12.1397


