Copyright
©2012 Baishideng Publishing Group Co.
World J Gastroenterol. Mar 28, 2012; 18(12): 1385-1390
Published online Mar 28, 2012. doi: 10.3748/wjg.v18.i12.1385
Published online Mar 28, 2012. doi: 10.3748/wjg.v18.i12.1385
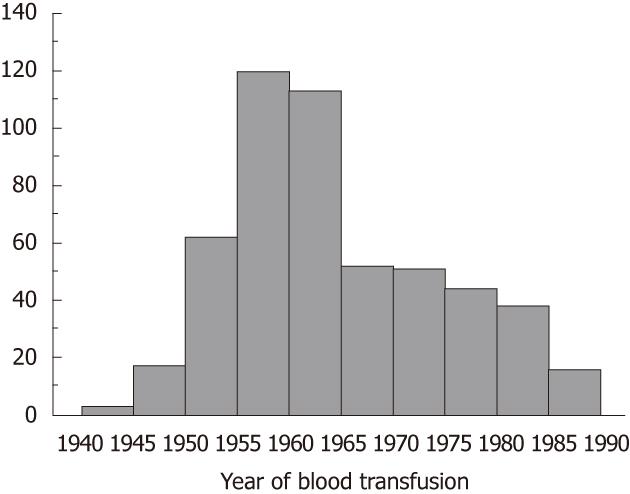
Figure 1 Frequency distribution of the year of receiving blood transfusion among the subjects.
There is a peak around the year 1960.
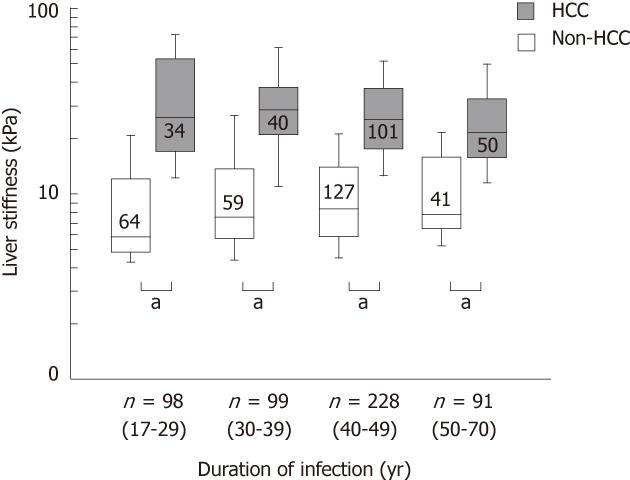
Figure 2 Duration of infection and liver stiffness.
Liver stiffness was higher in patients with HCC than in patients without in each infection duration group (aP < 0.0001 by Mann-Whitney U test).
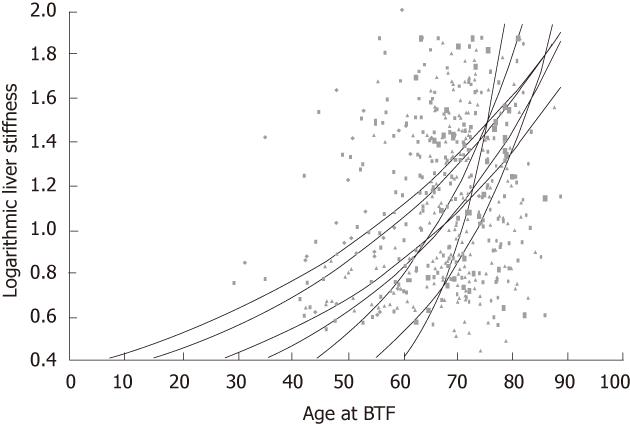
Figure 3 Age at blood transfusion and liver stiffness.
Stiffness at present (each dot) and stiffness at BTF (assumed to normal value) were connected approximate logarithmic curve. Stiffness progressions become rapid in older age at BTF.
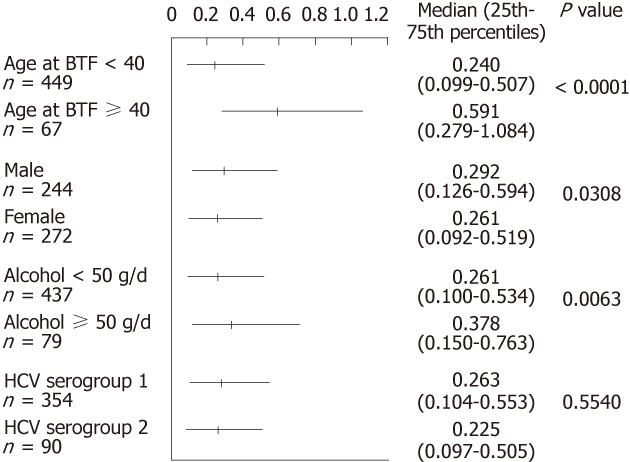
Figure 4 Liver stiffness progression rate.
The progression rate is significantly higher in patients who were older than 40 at the time of blood transfusion, whose alcohol consumption is more than 50 g/d, and who are male. There is no significant difference according to hepatitis C virus (HCV) serotypes. Horizontal bar represents median value and 25th-75th percentiles.
- Citation: Masuzaki R, Tateishi R, Yoshida H, Arano T, Uchino K, Enooku K, Goto E, Nakagawa H, Asaoka Y, Kondo Y, Goto T, Ikeda H, Shiina S, Omata M, Koike K. Assessment of disease progression in patients with transfusion-associated chronic hepatitis C using transient elastography. World J Gastroenterol 2012; 18(12): 1385-1390
- URL: https://www.wjgnet.com/1007-9327/full/v18/i12/1385.htm
- DOI: https://dx.doi.org/10.3748/wjg.v18.i12.1385


