Copyright
©2011 Baishideng Publishing Group Co.
World J Gastroenterol. Dec 14, 2011; 17(46): 5075-5082
Published online Dec 14, 2011. doi: 10.3748/wjg.v17.i46.5075
Published online Dec 14, 2011. doi: 10.3748/wjg.v17.i46.5075
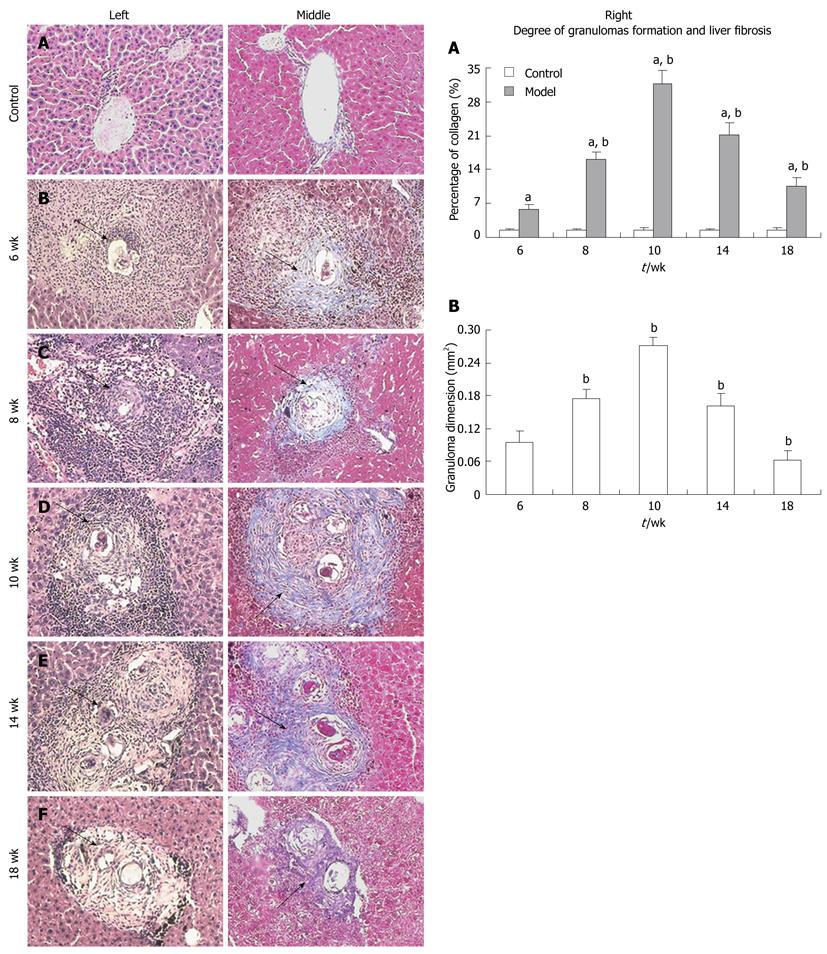
Figure 1 Representative images of hepatopathological changes over time.
HE (left) and MT (middle) staining and data showing the degree of granuloma formation and liver fibrosis (right). Arrows show granulomas. Collagen fibers are stained blue (MT staining). 100 × original magnification. HE: Hematoxylin and eosin; MT: Masson trichrome. aP < 0.05 vs control; bP < 0.05 vs previous.
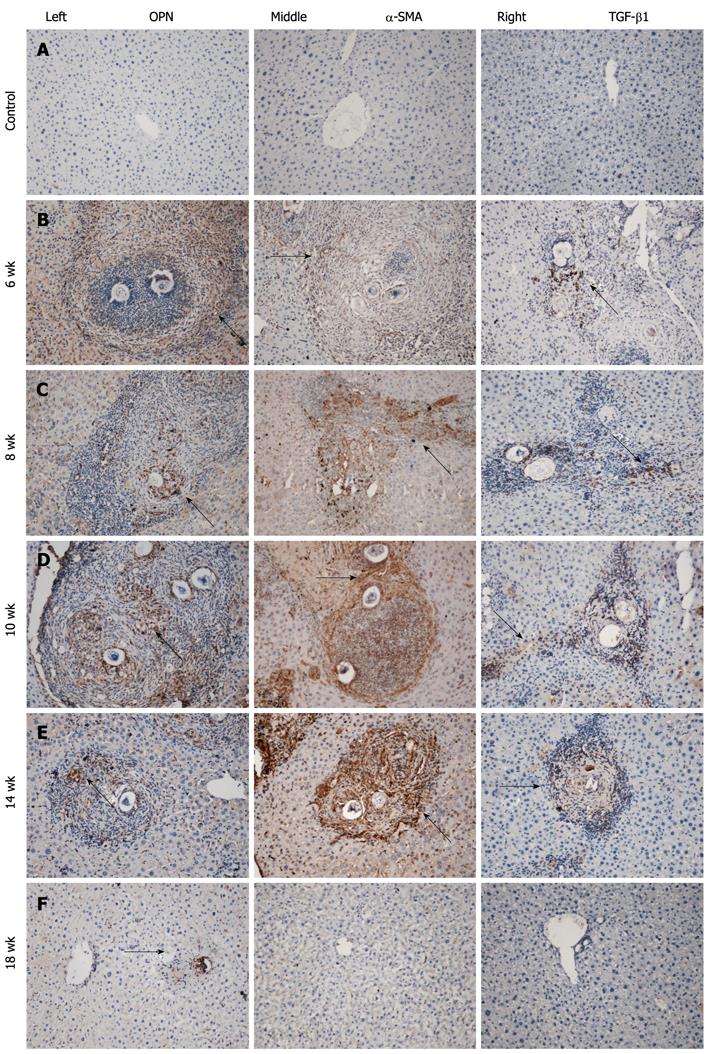
Figure 2 Representative images of immunostaining for osteopontin, α-SMA, and TGF-β1 over time in mouse liver.
Positive staining is yellow brown, and arrowheads show positive cells. 100 × original magnification. OPN: Osteopontin; SMA: Smooth muscle actin; TGF: Transforming growth factor.
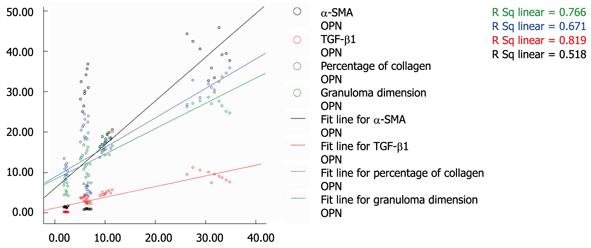
Figure 3 Correlation of osteopontin mRNA expression with α-SMA, TGF-β1, percentage of collagen, and the granuloma dimensions in the model group.
x-axis: IOD of osteopontin (× 102); y-axis: Black line: IOD of α-SMA (× 102); Red line: IOD of TGF-β1 (× 103); Blue line: Collagen (%); Green line: Granuloma dimension, mm2 (× 102). OPN: Osteopontin; SMA: Smooth muscle actin; TGF: Transforming growth factor.
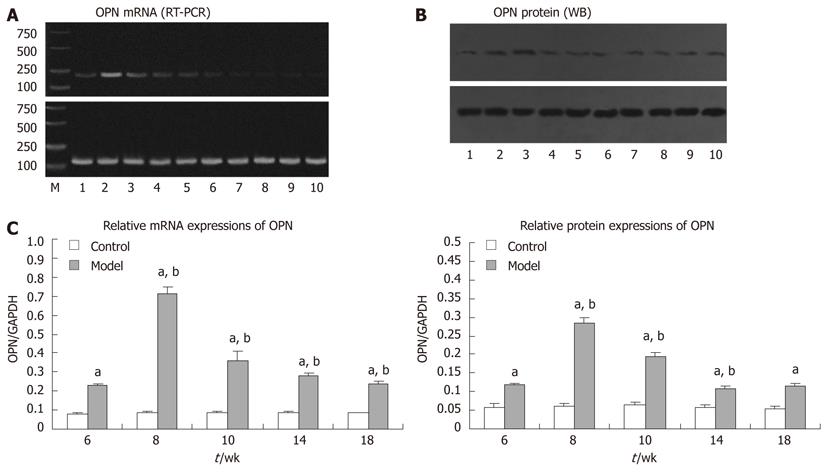
Figure 4 Profiles of osteopontin mRNA (RT-PCR) and protein (Western blotting) expression.
No. 1-5 represent the model group at week 6, 8, 10, 14, and 18, respectively; No. 6-10 represent the control group at week 6, 8, 10, 14, and 18, respectively. A: Expression of osteopontin and GAPDH mRNA over time, the 100-bp GAPDH mRNA fragment was used as an internal control; B: Expression of osteopontin and GAPDH protein over time, the 37-kDa GAPDH band was used as an internal control; C: The IOD of osteopontin/GAPDH was expressed as the mean ± SD. M: Marker; n = 10 at each time. OPN: Osteopontin; RT-PCR: Reverse transcription polymerase chain reaction; GAPDH: Glyceraldehyde-3-phosphate dehydrogenase; IOD: Integral optical density. aP < 0.05 vs control; bP < 0.05 vs previous.
-
Citation: Chen BL, Zhang GY, Yuan WJ, Wang SP, Shen YM, Yan L, Gu H, Li J. Osteopontin expression is associated with hepatopathologic changes in
Schistosoma japonicum infected mice. World J Gastroenterol 2011; 17(46): 5075-5082 - URL: https://www.wjgnet.com/1007-9327/full/v17/i46/5075.htm
- DOI: https://dx.doi.org/10.3748/wjg.v17.i46.5075


