Copyright
©2011 Baishideng Publishing Group Co.
World J Gastroenterol. Nov 21, 2011; 17(43): 4810-4816
Published online Nov 21, 2011. doi: 10.3748/wjg.v17.i43.4810
Published online Nov 21, 2011. doi: 10.3748/wjg.v17.i43.4810
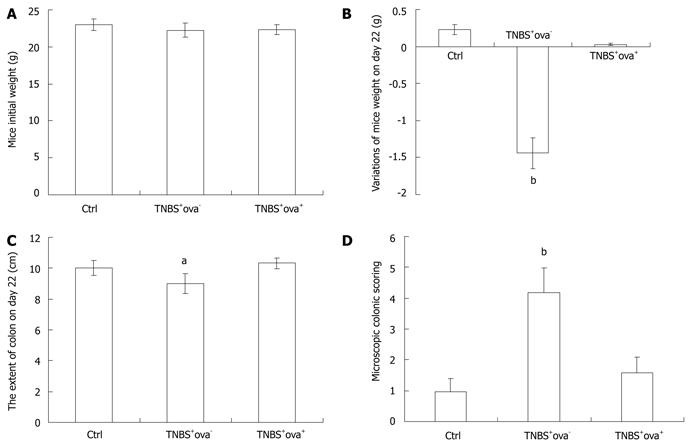
Figure 1 The evaluations of colitis.
The initial weight of each group (A) and variations of weight (B), colon extent (C) and microscopic colonic scoring (D) on day 22. Data are presented as mean ± SD. n = 10, aP < 0.05 vs the other two groups; bP < 0.01 vs the other two groups. TNBS: Trinitrobenzenesulfonic acid.
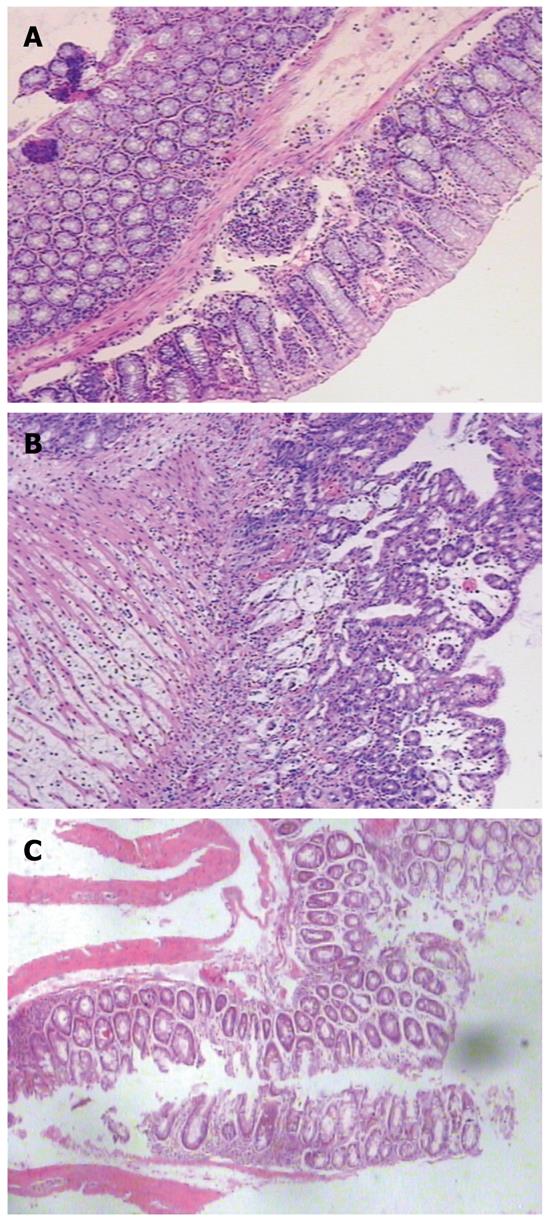
Figure 2 The histology of the colon in different group of mice (HE, × 10).
Rare inflammation was found in controls (A). Transmural chronic inflammation was observed in TNBS-induced colitis (B). The inflammation was significantly relieved in schistosome ova treated mice (C). HE: Hematoxylin and eosin; TNBS: Trinitrobenzenesulfonic acid.
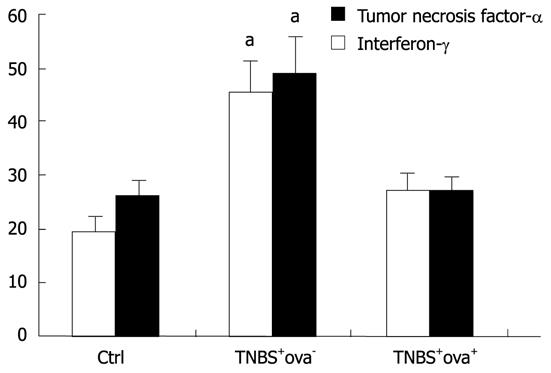
Figure 3 The serum levels of tumor necrosis factor-α (white bar) and interferon-γ (black bar).
Data are presented as mean ± SD. There were 20 animals in the control group and the TNBS+ova- group and 24 in the TNBS+ova+ group. aP < 0.05 vs the other two groups. TNBS: Trinitrobenzenesulfonic acid.
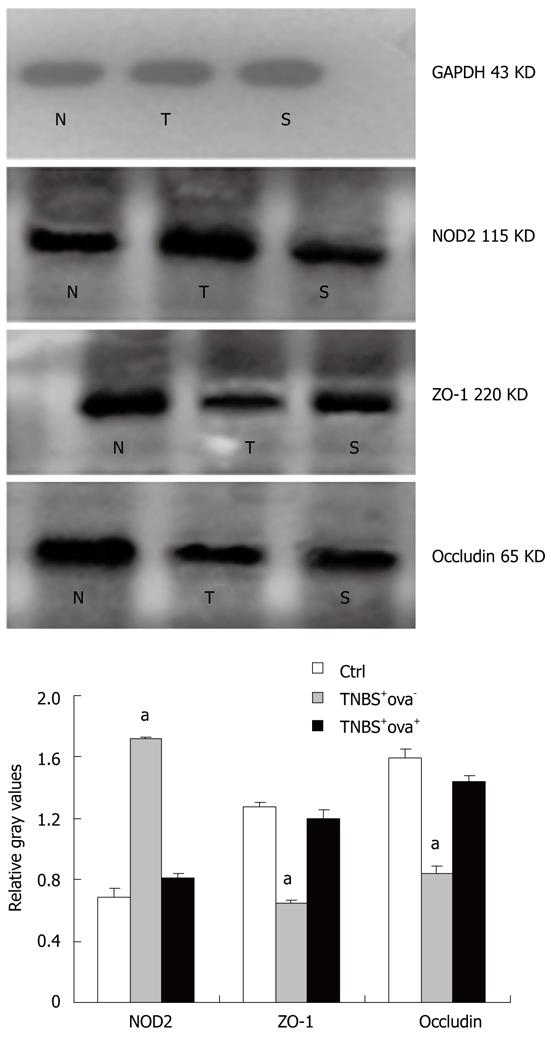
Figure 4 Effect of Schistosoma japonicum ova on the expression of NOD2, ZO-1 and occludin (Western blotting).
White bar represents the control group (N), grey bar represents the TNBS+ova- group (T), black bar represents the TNBS+ova+ group (S). Data are presented as mean ± SE. n = 10. aP < 0.05 vs the other two groups. NOD2: Nucleotide-binding-oligomerization domain 2; TNBS: Trinitrobenzenesulfonic acid; GAPDH: Glyceraldehyde phosphate dehydrogenase.
Figure 5 Effect of Schistosoma japonicum ova on the expression of NOD2 mRNA (Realtime-PCR).
M: Marker; G: GAPDH; N: Control group; T: TNBS+ova- group; S: TNBS+ova+ group. Data are presented as mean ± SE. n = 10. aP < 0.05 vs the other two groups. GAPDH: Glyceraldehyde phosphate dehydrogenase; TNBS: Trinitrobenzenesulfonic acid.
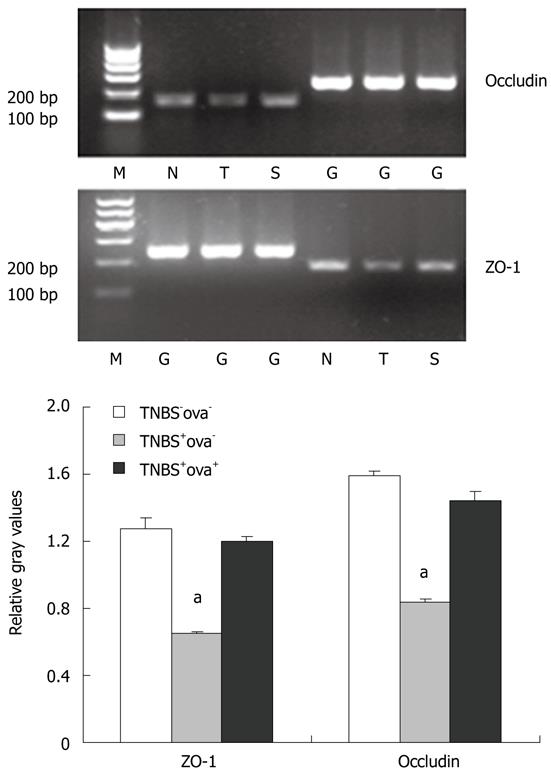
Figure 6 Effect of Schistosoma japonicum ova on the expression of ZO-1 and occludin mRNA (Realtime-PCR).
White bar represents the control group (N), grey bar represents the TNBS+ova- group (T), black bar represents the TNBS+ova+ group (S). M: Marker; G: GAPDH. Data are presented as mean ± SE. n = 10. aP < 0.05 vs the other two groups. GAPDH: Glyceraldehyde phosphate dehydrogenase. TNBS: Trinitrobenzenesulfonic acid.
-
Citation: Xia CM, Zhao Y, Jiang L, Jiang J, Zhang SC.
Schistosoma japonicum ova maintains epithelial barrier function during experimental colitis. World J Gastroenterol 2011; 17(43): 4810-4816 - URL: https://www.wjgnet.com/1007-9327/full/v17/i43/4810.htm
- DOI: https://dx.doi.org/10.3748/wjg.v17.i43.4810


