Copyright
©2011 Baishideng Publishing Group Co.
World J Gastroenterol. Nov 21, 2011; 17(43): 4810-4816
Published online Nov 21, 2011. doi: 10.3748/wjg.v17.i43.4810
Published online Nov 21, 2011. doi: 10.3748/wjg.v17.i43.4810
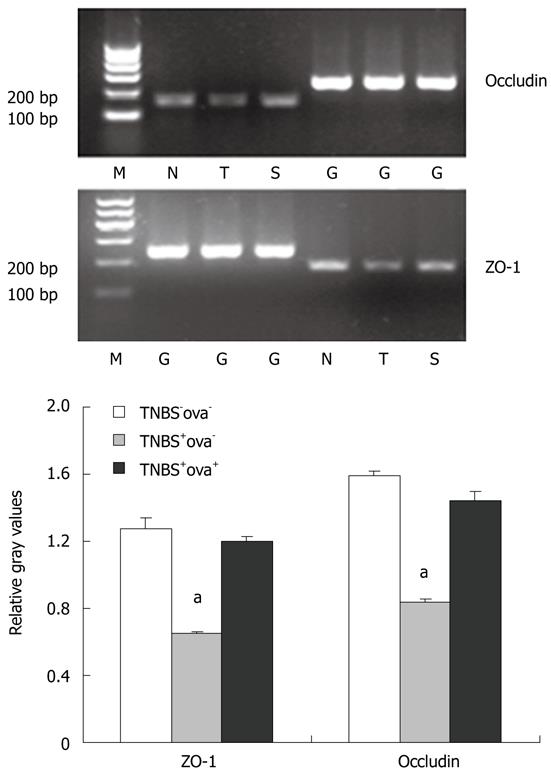
Figure 6 Effect of Schistosoma japonicum ova on the expression of ZO-1 and occludin mRNA (Realtime-PCR).
White bar represents the control group (N), grey bar represents the TNBS+ova- group (T), black bar represents the TNBS+ova+ group (S). M: Marker; G: GAPDH. Data are presented as mean ± SE. n = 10. aP < 0.05 vs the other two groups. GAPDH: Glyceraldehyde phosphate dehydrogenase. TNBS: Trinitrobenzenesulfonic acid.
-
Citation: Xia CM, Zhao Y, Jiang L, Jiang J, Zhang SC.
Schistosoma japonicum ova maintains epithelial barrier function during experimental colitis. World J Gastroenterol 2011; 17(43): 4810-4816 - URL: https://www.wjgnet.com/1007-9327/full/v17/i43/4810.htm
- DOI: https://dx.doi.org/10.3748/wjg.v17.i43.4810


