Copyright
©2011 Baishideng Publishing Group Co.
World J Gastroenterol. Nov 7, 2011; 17(41): 4572-4580
Published online Nov 7, 2011. doi: 10.3748/wjg.v17.i41.4572
Published online Nov 7, 2011. doi: 10.3748/wjg.v17.i41.4572
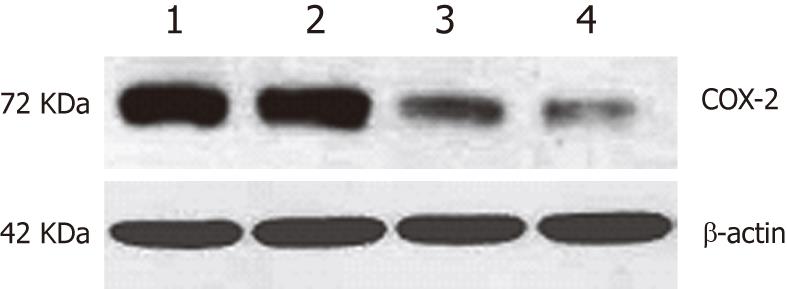
Figure 1 Western blotting for cyclooxygenase-2 protein expression after transfection of EC109 cells.
1: Parental cells; 2: hCOX-2-transfected cells; 3: Vector control cells; 4: Cells treated with aspirin for 48 h after transfection with hCOX-2.
Figure 2 Western blotting for cyclooxygenase-2 protein expression after RNA interference treatment of EC109 cells.
1: Parental cells; 2: Negative control siRNA; 3: Cyclooxygenase-2 (COX-2) short interfering RNA (siRNA); 4: Cells treated with aspirin for 48 h after transfection with COX-2 siRNA.
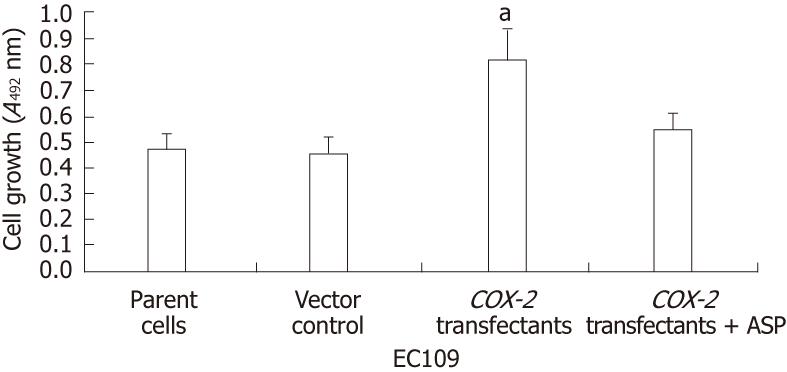
Figure 3 Inhibition of cell proliferation in EC109 cells by hCOX-2 transfection and aspirin treatment (n = 3, mean ± SD).
aP < 0.05. ASP: Aspirin.
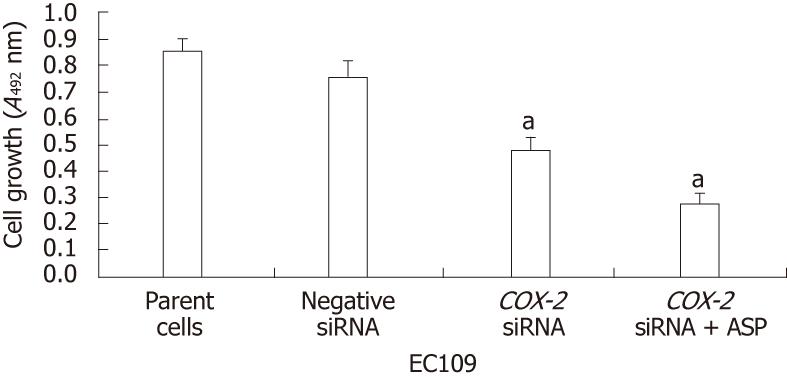
Figure 4 Inhibition of cell proliferation in EC109 cells by short interfering RNA and aspirin treatment (n = 3, mean ± SD).
aP < 0.01. siRNA: Short interfering RNA; ASP: Aspirin.
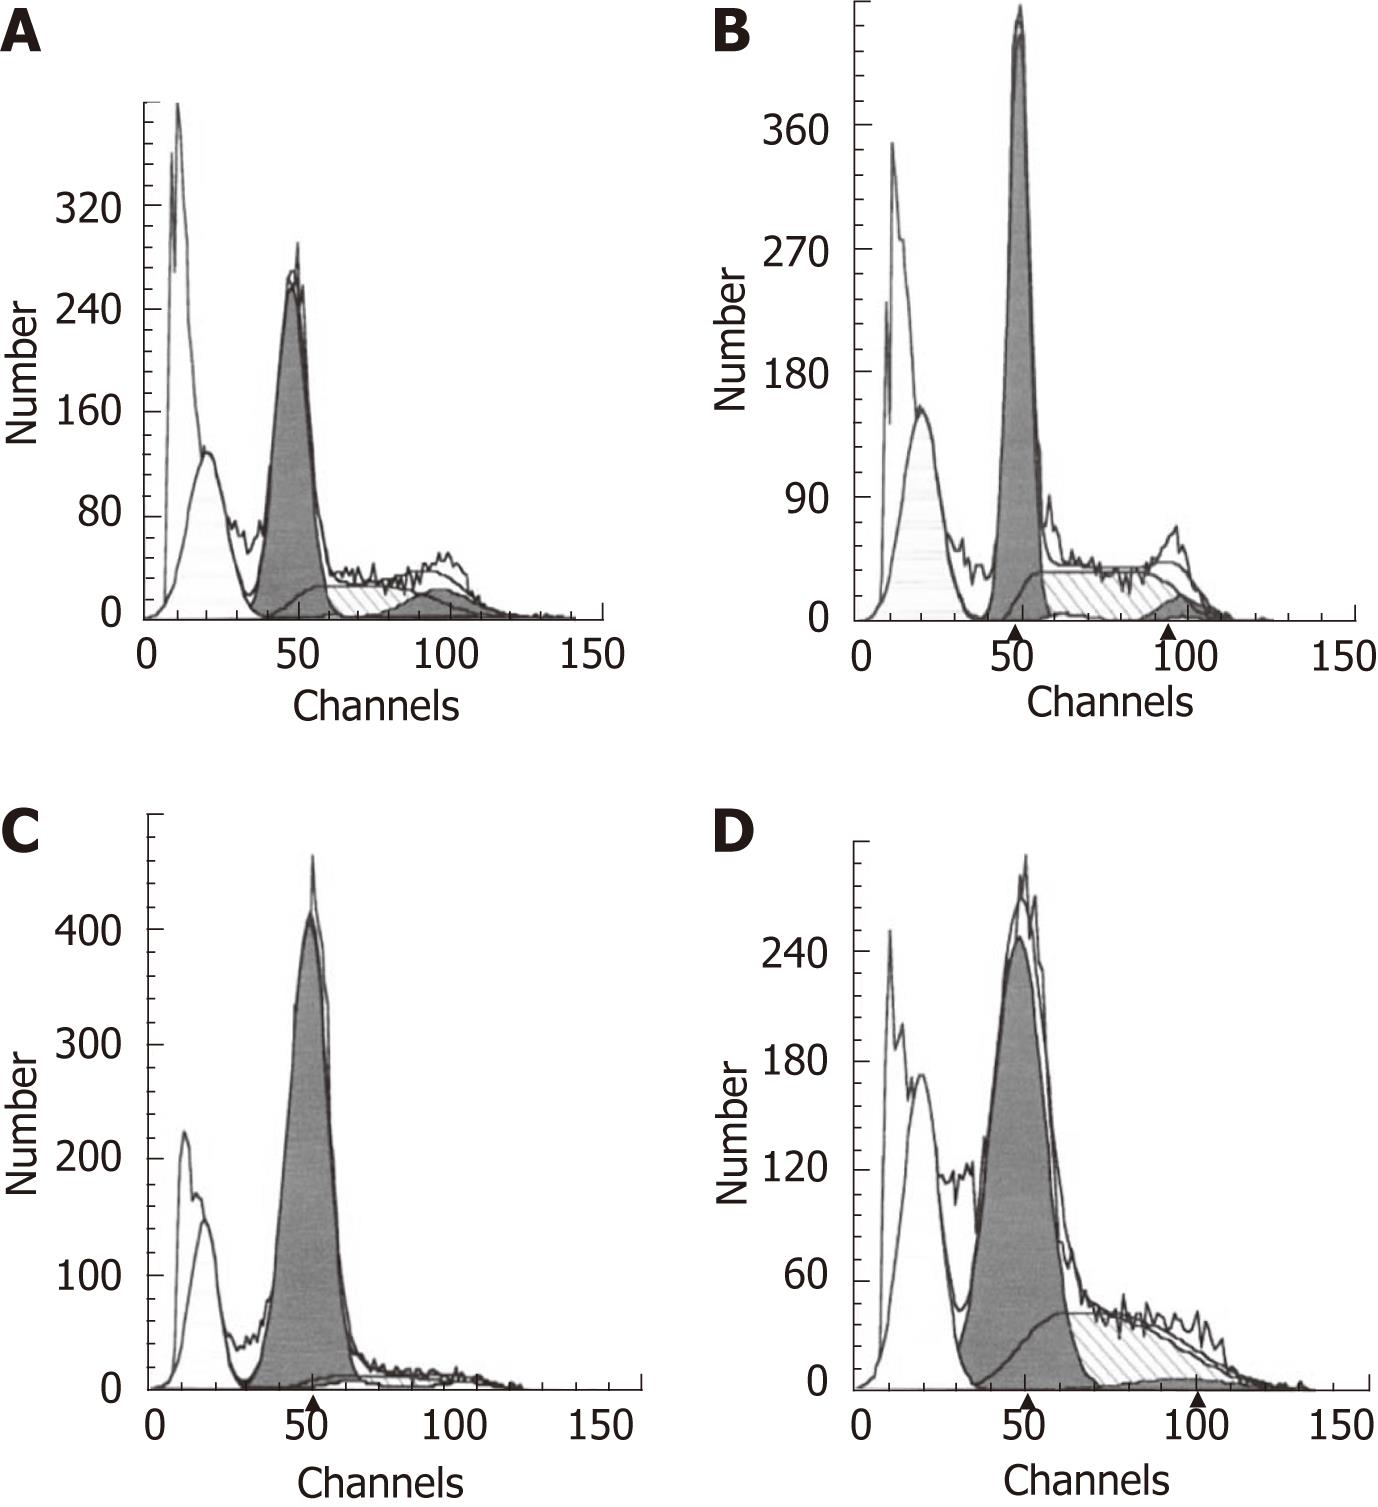
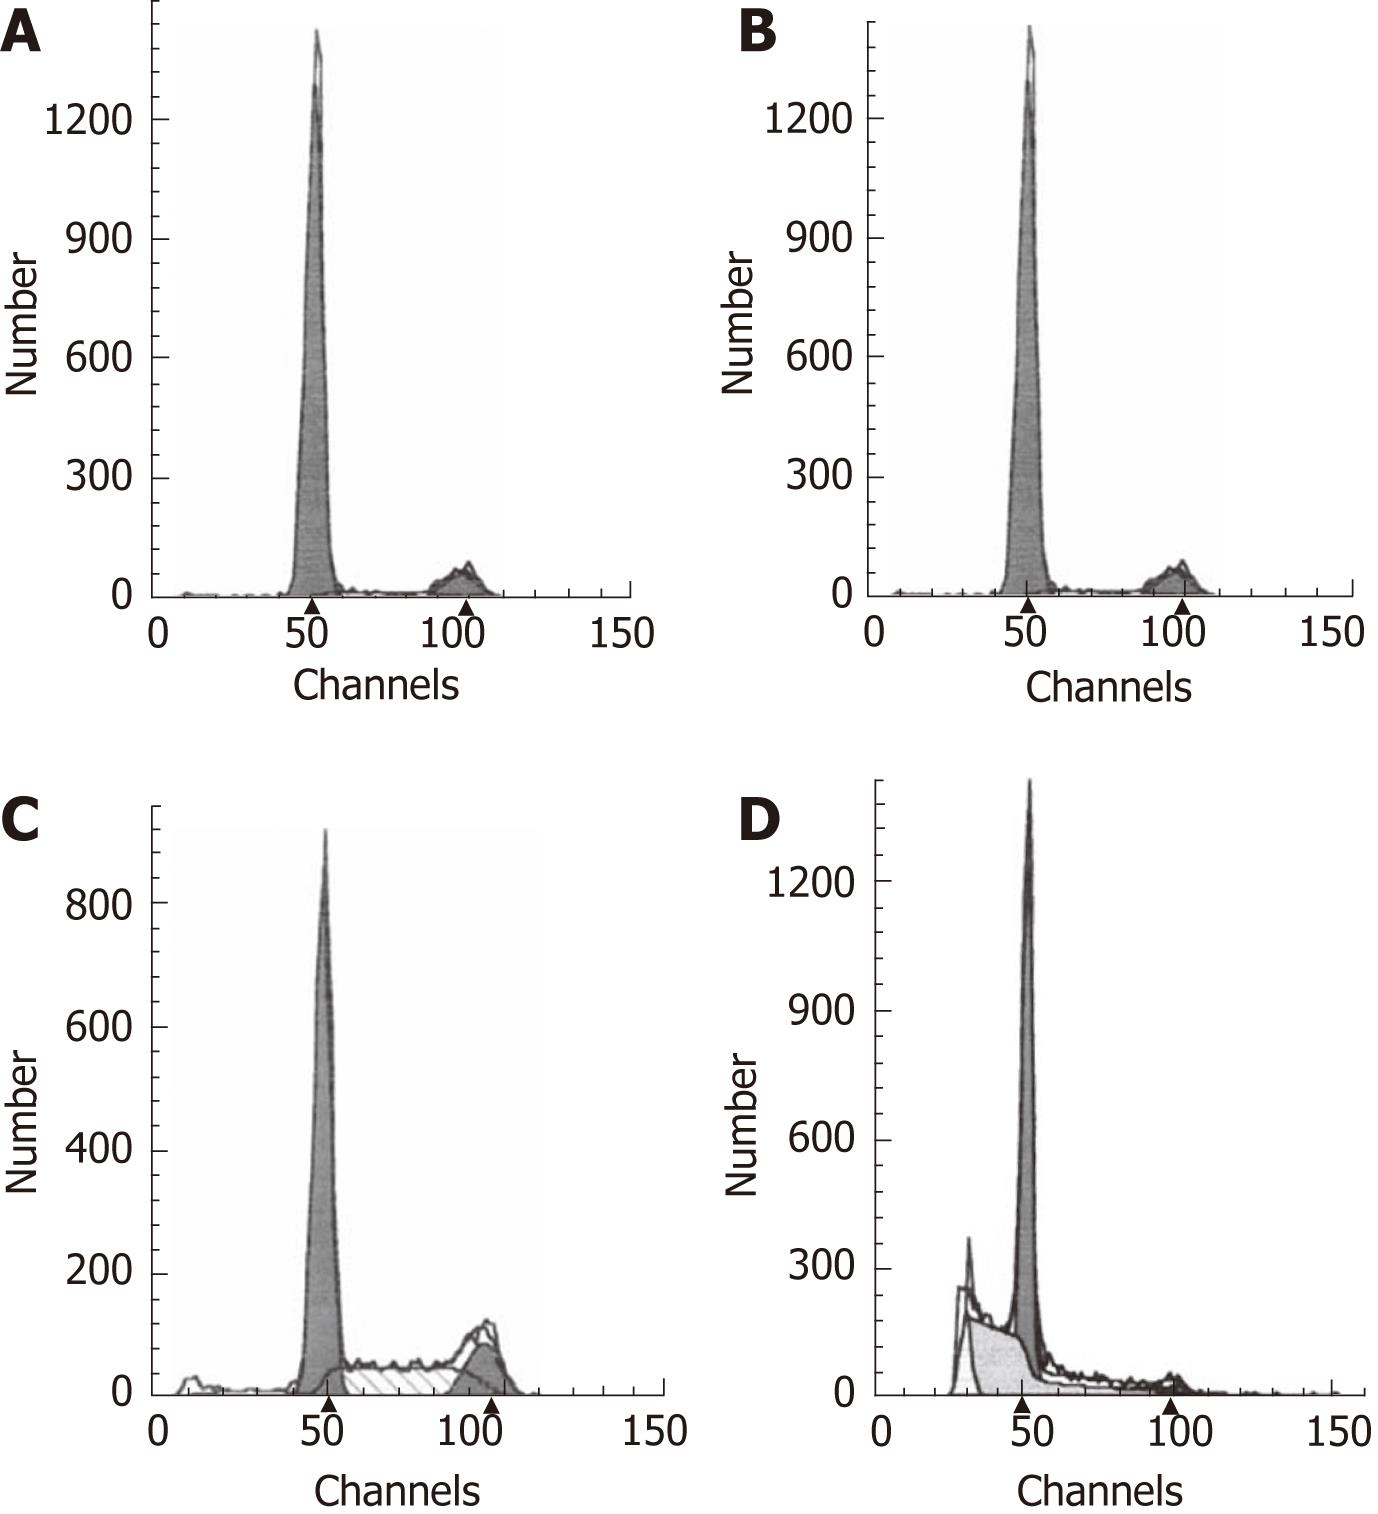
Figure 5 hCOX-2 transfection and aspirin treatment induces apoptosis in EC109 cells.
A: Parental cells; B: Samples transfected with the control pcDNA3.1V5HisA vector; C: Samples transfected with the cyclooxygenase-2-expressing plasmid pcDNA3.1V5HisA/hCOX-2; D: Samples transfected with the pcDNA3.1V5HisA/hCOX-2 plasmid for 24 h and treated with aspirin for an additional 48 h.
Figure 6 Short interfering RNA-mediated cyclooxygenase-2 knockdown with aspirin treatment induces apoptosis in EC109 cells.
A: Parental cells; B: Samples treated with the negative control short interfering RNA (siRNA); C: Samples treated with cyclooxygenase-2 (COX-2) siRNA; D: Samples treated with COX-2 siRNA for 48 h and treated with aspirin for an additional 36 h.
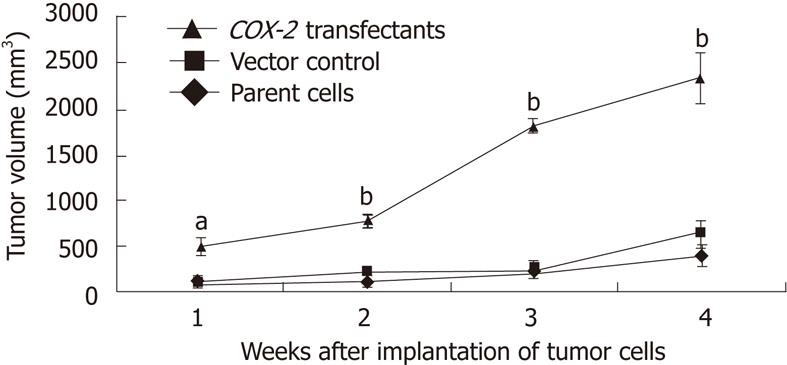
Figure 7 Effect of cyclooxygenase-2 on tumor growth in the nude mouse xenograft tumor model (n = 15, mean ± SD).
aP < 0.05, bP < 0.01. COX-2: Cyclooxygenase-2.
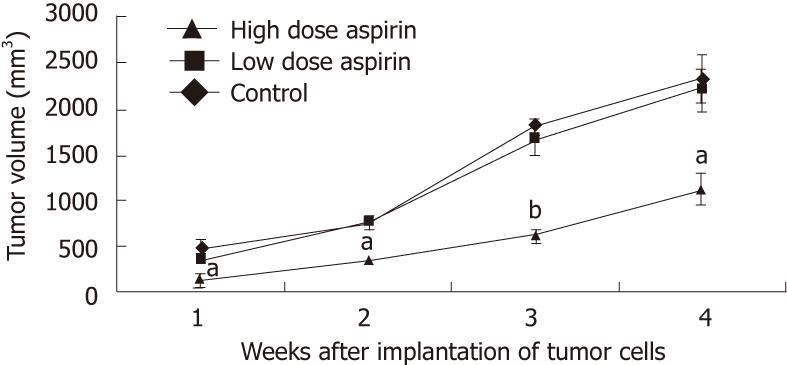
Figure 8 Effect of aspirin on tumor growth in the nude mouse xenograft tumor model (n = 15, mean ± SD).
aP < 0.05, bP < 0.01.
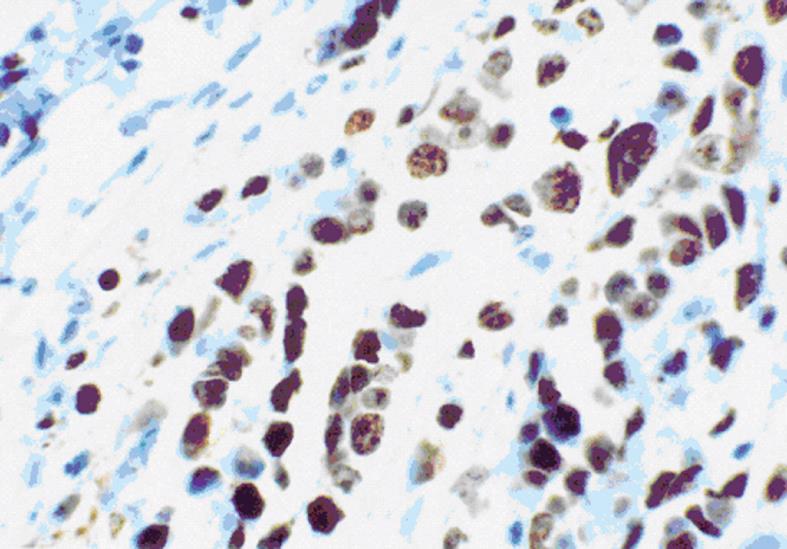
Figure 9 Ki-67 expression in the nuclei of cells in xenograft tumors from pcDNA3.
1V5HisA/hCOX-2-transfected EC109 cells at 400 x magnification.
- Citation: Zhang L, Wu YD, Li P, Tu J, Niu YL, Xu CM, Zhang ST. Effects of cyclooxygenase-2 on human esophageal squamous cell carcinoma. World J Gastroenterol 2011; 17(41): 4572-4580
- URL: https://www.wjgnet.com/1007-9327/full/v17/i41/4572.htm
- DOI: https://dx.doi.org/10.3748/wjg.v17.i41.4572


