Copyright
©2011 Baishideng Publishing Group Co.
World J Gastroenterol. Sep 21, 2011; 17(35): 3976-3985
Published online Sep 21, 2011. doi: 10.3748/wjg.v17.i35.3976
Published online Sep 21, 2011. doi: 10.3748/wjg.v17.i35.3976
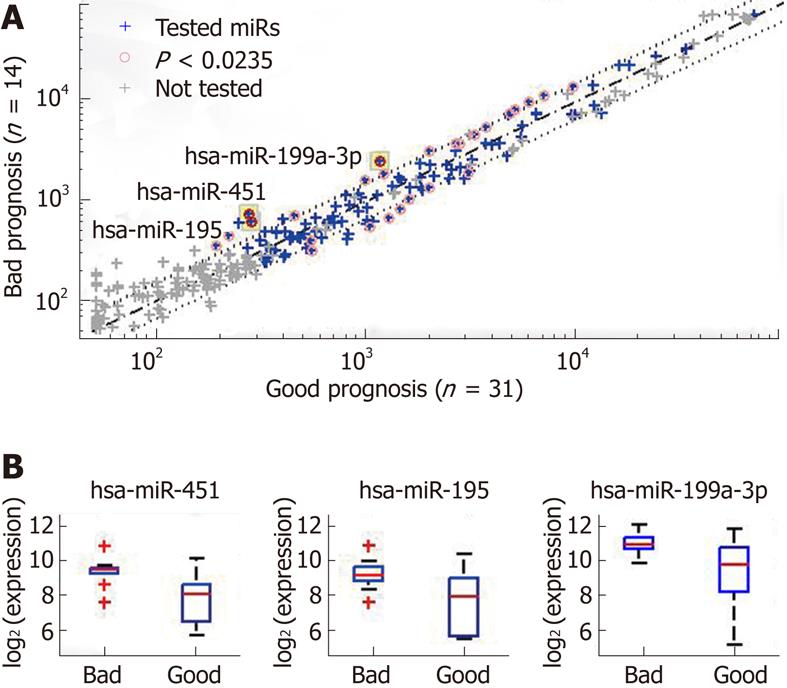
Figure 1 Differential expression of microRNAs between gastric cancer patients with good prognosis (no recurrence within 36 mo from surgery) or bad prognosis (recurrence within 36 mo).
A: Median expression data (in normalized florescence units) are shown for all microarray probes (crosses). MiRs with low expression (below 300 units) in both groups and control probes were not tested for expression differences (grey crosses); 112 miRs (blue crosses) were tested using a rank-sum (Wilcoxon-Mann-Whitney) test. Twenty-six miRs had a P < 0.0235 (pink circles), corresponding to a false discovery rate = 0.1. Of these, three miRs (highlighted) also had a fold-change of > 2: miR-451, miR-195 and miR-199a-3p. B: Box-plots of the expression levels (in log2 normalized florescence units) of these three miRs in the good/bad prognosis groups. Plots show the median (horizontal line), 25th to 75th percentile (box), extent of data (“whiskers”, extending up to 1.5 times the inter-quartile range), and outliers (red crosses, values outside the range of the whiskers). miR: MicroRNA.
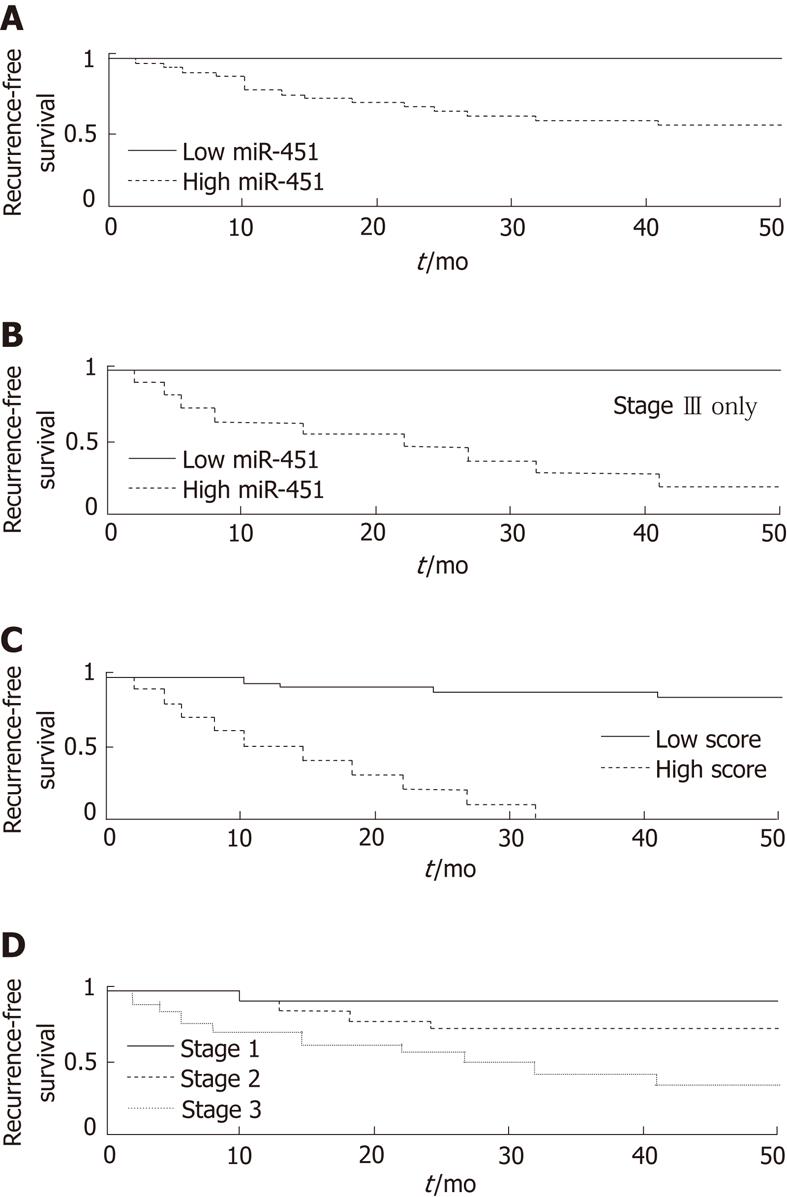
Figure 2 Kaplan-Meier model of disease recurrence for gastric cancer patients, showing the fraction without disease recurrence as function of time from surgery.
A: The population was divided into groups with high expression (n = 32) or low expression (n = 13) of miR-451, based on best separation (log-rank P = 0.0009). B: Recurrence for patients with stage III gastric cancer only, grouped by low expression (n = 3) or high expression (n = 11) expression of miR-451, based on best separation (log-rank P = 0.026). C: Population grouped by composite score, calculated as 0.827*log2 (miR-451 expression) + 1.57*stage, using Cox regression coefficients. The threshold used (11.86) maximizes the separation between high score (n = 10, poor prognosis) and low score (n = 35, good prognosis). Although the positive predictive value with this threshold was lower than obtained using miR-451 alone (panel A), and recurrence-free survival of the good-prognosis group was not 100% as obtained for miR-451 (4 of the 35 patients in the low-score group had a recurrence before 36 mo), the negative predictive value increased to 100% (all 10 cases in the high-score group had recurrence by 36 mo) and the separation was much more significant (P = 2∙10-10). D: Population split by stage. P = 0.00013 between stages I and III(log-rank test). miR: MicroRNA.
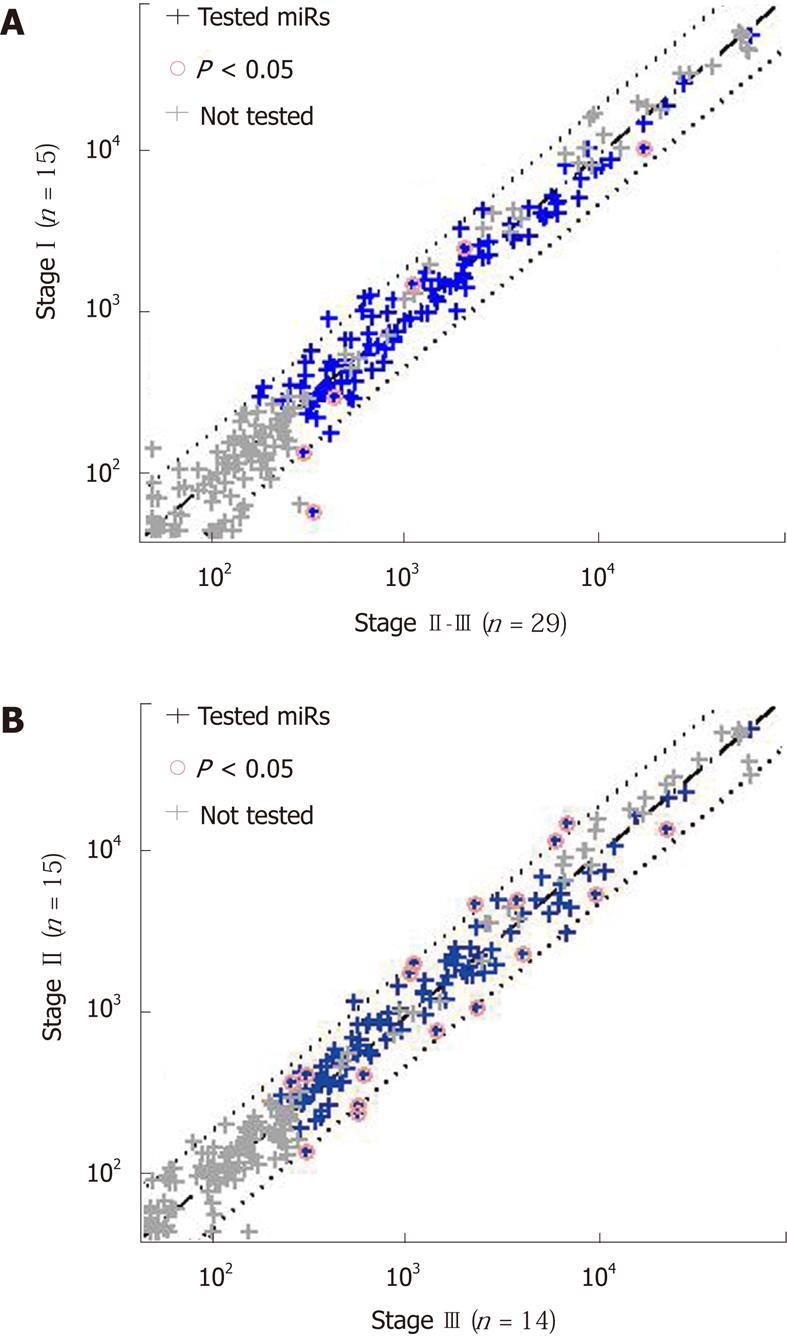
Figure 3 Differential expression of miRs in gastric cancer tumors by clinical disease stage (at surgery).
Median expression data (in normalized fluorescence units) are shown for all microarray probes (crosses). MiRs with low expression (below 300 units) in both groups and control probes were not tested for expression differences (grey crosses). A: 112 miRs (blue crosses) were tested by rank-sum test for expression between stage I tumors and stages II-III tumors. None of the miRs passed the false discovery rate (FDR) threshold of 0.2; 6 miRs had a P < 0.05 (pink circles). B: 111 miRs (blue crosses) were tested for expression between stage II tumors and stage III tumors. None of the miRs passed the FDR threshold of 0.2; 17 miRs had a P < 0.05 (pink circles). Diagonal lines show the equal median expression (dashed line) and the twofold change in median expression (dotted lines). miR: MicroRNA.
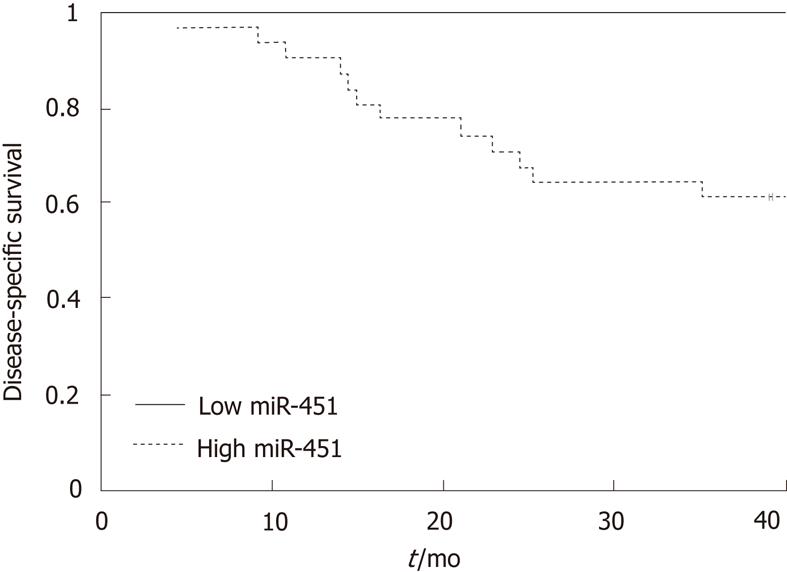
Figure 4 Kaplan-Meier model of disease-specific survival for patients with gastric cancer, grouped by high expression (n = 32) or low expression (n = 13) of miR-451, using the threshold of miR-451 expression that optimized the positive predictive value (181 normalized fluorescence units, P = 0.
005). Among the patients whose tumors expressed low levels of miR-451, no disease-specific deaths occurred within 36 mo of surgery.
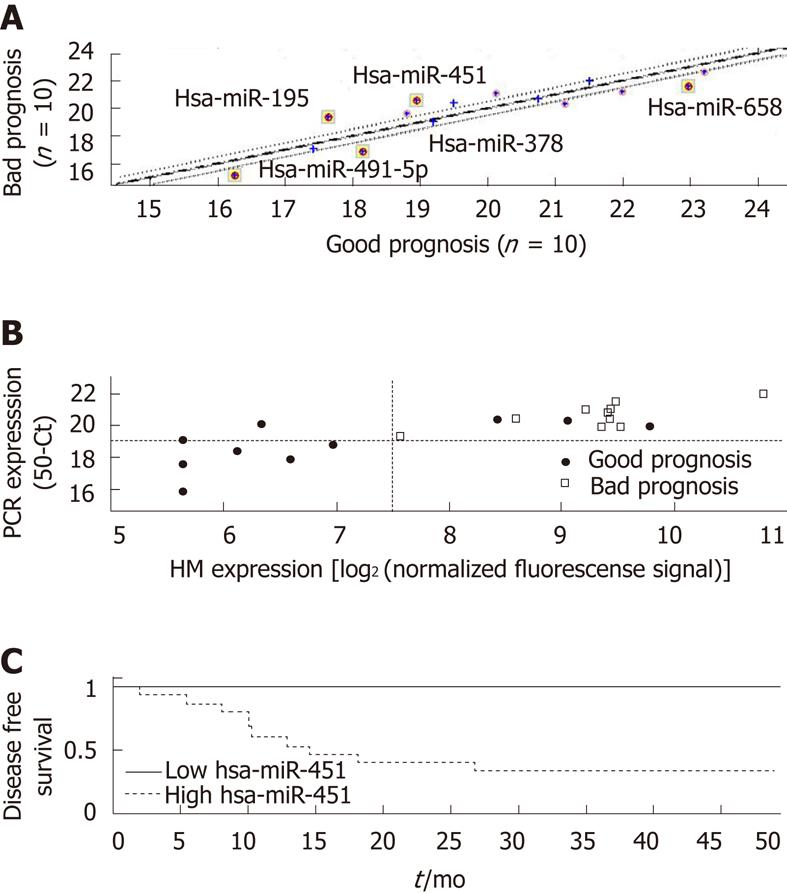
Figure 5 Validation by quantitative real-time polymerase chain reaction A: Differential expression of microRNAs (miRs) between a subset of the gastric cancer samples from patients with good prognosis (n = 10) or bad prognosis (n = 10).
Median expression data are shown for all probes tested. Cycle threshold (CT) values are the inverses of the log signals; therefore, median values are given in 50-CT (50CT) to maintain the same sense as the array data; B: Correlation of expression signals of miR-451 between microarrays (log2 normalized fluorescence units) and quantitative real-time polymerase chain reaction (qRT-PCR) (50CT). Good-prognosis cases are represented by filled circles, bad-prognosis cases by empty squares. Dotted lines indicate the thresholds of the miR-451 signal at normalized fluorescence of 181 units [log2(181) = 7.5] and at 50CT = 19. The correlation coefficient (Pearson) between the signals is 0.83; C: Recurrence in 20 cases, measured by qRT-PCR, grouped by 50CT < 19 (solid line, n = 5) or 50CT > 19 (dotted line, n = 15). P = 0.015 by log-rank test. MiR: MicroRNA; PCR: Polymerase chain reaction; HM: Human custom microRNA-Microarray.
- Citation: Brenner B, Hoshen MB, Purim O, David MB, Ashkenazi K, Marshak G, Kundel Y, Brenner R, Morgenstern S, Halpern M, Rosenfeld N, Chajut A, Niv Y, Kushnir M. MicroRNAs as a potential prognostic factor in gastric cancer. World J Gastroenterol 2011; 17(35): 3976-3985
- URL: https://www.wjgnet.com/1007-9327/full/v17/i35/3976.htm
- DOI: https://dx.doi.org/10.3748/wjg.v17.i35.3976


