Copyright
©2011 Baishideng Publishing Group Co.
World J Gastroenterol. Sep 21, 2011; 17(35): 3976-3985
Published online Sep 21, 2011. doi: 10.3748/wjg.v17.i35.3976
Published online Sep 21, 2011. doi: 10.3748/wjg.v17.i35.3976
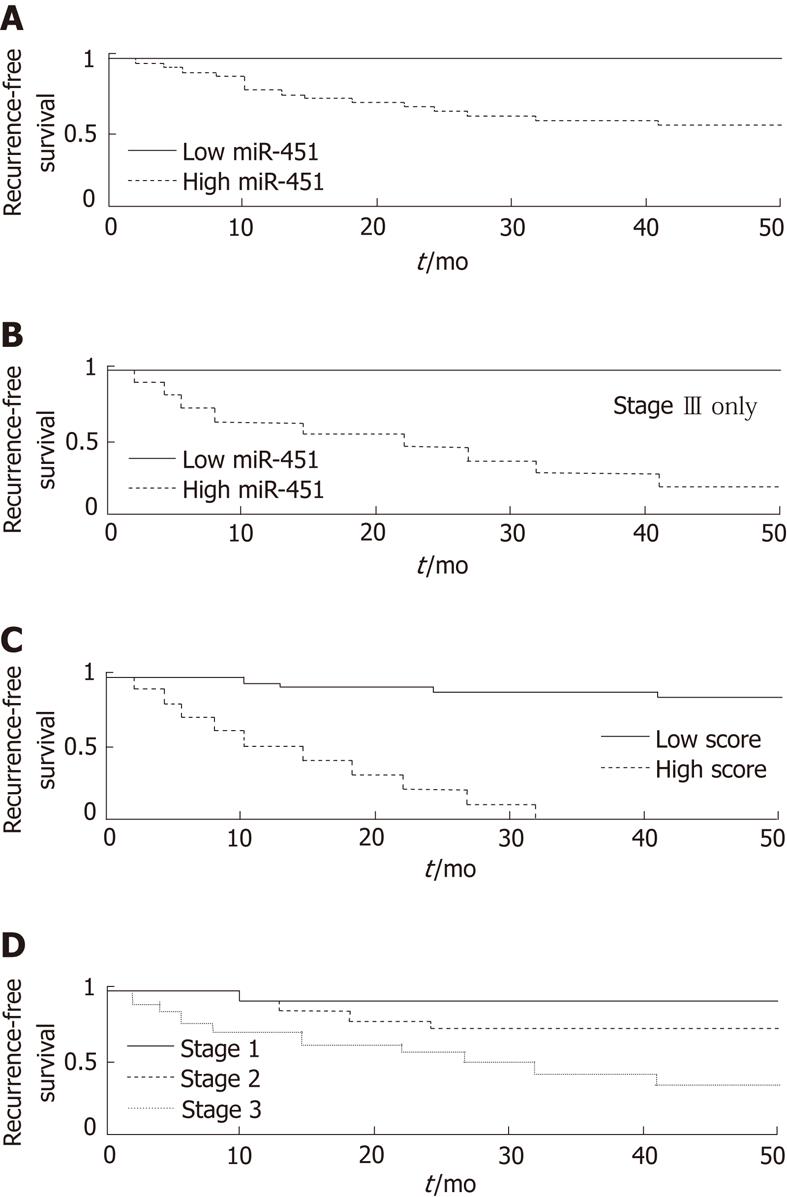
Figure 2 Kaplan-Meier model of disease recurrence for gastric cancer patients, showing the fraction without disease recurrence as function of time from surgery.
A: The population was divided into groups with high expression (n = 32) or low expression (n = 13) of miR-451, based on best separation (log-rank P = 0.0009). B: Recurrence for patients with stage III gastric cancer only, grouped by low expression (n = 3) or high expression (n = 11) expression of miR-451, based on best separation (log-rank P = 0.026). C: Population grouped by composite score, calculated as 0.827*log2 (miR-451 expression) + 1.57*stage, using Cox regression coefficients. The threshold used (11.86) maximizes the separation between high score (n = 10, poor prognosis) and low score (n = 35, good prognosis). Although the positive predictive value with this threshold was lower than obtained using miR-451 alone (panel A), and recurrence-free survival of the good-prognosis group was not 100% as obtained for miR-451 (4 of the 35 patients in the low-score group had a recurrence before 36 mo), the negative predictive value increased to 100% (all 10 cases in the high-score group had recurrence by 36 mo) and the separation was much more significant (P = 2∙10-10). D: Population split by stage. P = 0.00013 between stages I and III(log-rank test). miR: MicroRNA.
- Citation: Brenner B, Hoshen MB, Purim O, David MB, Ashkenazi K, Marshak G, Kundel Y, Brenner R, Morgenstern S, Halpern M, Rosenfeld N, Chajut A, Niv Y, Kushnir M. MicroRNAs as a potential prognostic factor in gastric cancer. World J Gastroenterol 2011; 17(35): 3976-3985
- URL: https://www.wjgnet.com/1007-9327/full/v17/i35/3976.htm
- DOI: https://dx.doi.org/10.3748/wjg.v17.i35.3976


