Copyright
©2011 Baishideng Publishing Group Co.
World J Gastroenterol. Sep 21, 2011; 17(35): 3976-3985
Published online Sep 21, 2011. doi: 10.3748/wjg.v17.i35.3976
Published online Sep 21, 2011. doi: 10.3748/wjg.v17.i35.3976
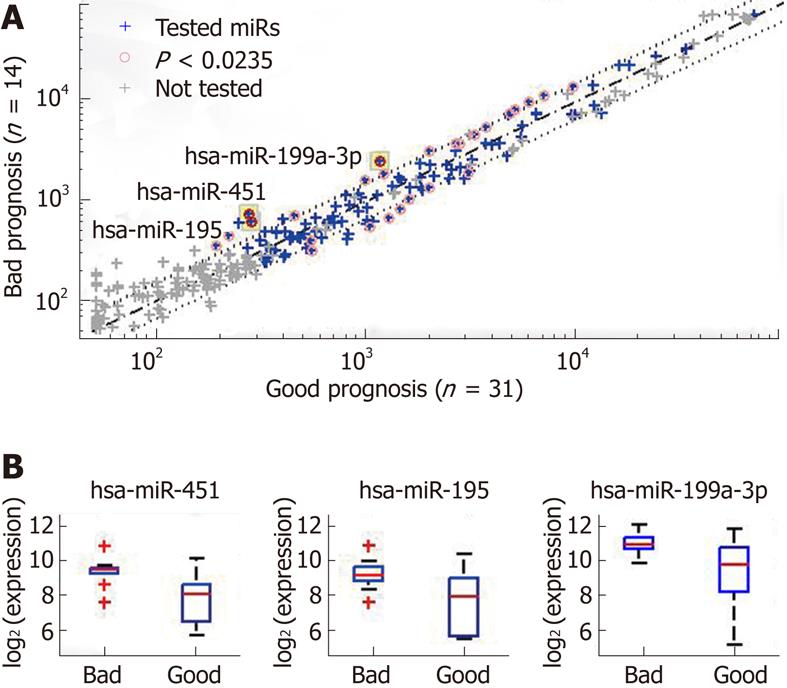
Figure 1 Differential expression of microRNAs between gastric cancer patients with good prognosis (no recurrence within 36 mo from surgery) or bad prognosis (recurrence within 36 mo).
A: Median expression data (in normalized florescence units) are shown for all microarray probes (crosses). MiRs with low expression (below 300 units) in both groups and control probes were not tested for expression differences (grey crosses); 112 miRs (blue crosses) were tested using a rank-sum (Wilcoxon-Mann-Whitney) test. Twenty-six miRs had a P < 0.0235 (pink circles), corresponding to a false discovery rate = 0.1. Of these, three miRs (highlighted) also had a fold-change of > 2: miR-451, miR-195 and miR-199a-3p. B: Box-plots of the expression levels (in log2 normalized florescence units) of these three miRs in the good/bad prognosis groups. Plots show the median (horizontal line), 25th to 75th percentile (box), extent of data (“whiskers”, extending up to 1.5 times the inter-quartile range), and outliers (red crosses, values outside the range of the whiskers). miR: MicroRNA.
- Citation: Brenner B, Hoshen MB, Purim O, David MB, Ashkenazi K, Marshak G, Kundel Y, Brenner R, Morgenstern S, Halpern M, Rosenfeld N, Chajut A, Niv Y, Kushnir M. MicroRNAs as a potential prognostic factor in gastric cancer. World J Gastroenterol 2011; 17(35): 3976-3985
- URL: https://www.wjgnet.com/1007-9327/full/v17/i35/3976.htm
- DOI: https://dx.doi.org/10.3748/wjg.v17.i35.3976


