Copyright
©2011 Baishideng Publishing Group Co.
World J Gastroenterol. Jun 21, 2011; 17(23): 2867-2872
Published online Jun 21, 2011. doi: 10.3748/wjg.v17.i23.2867
Published online Jun 21, 2011. doi: 10.3748/wjg.v17.i23.2867
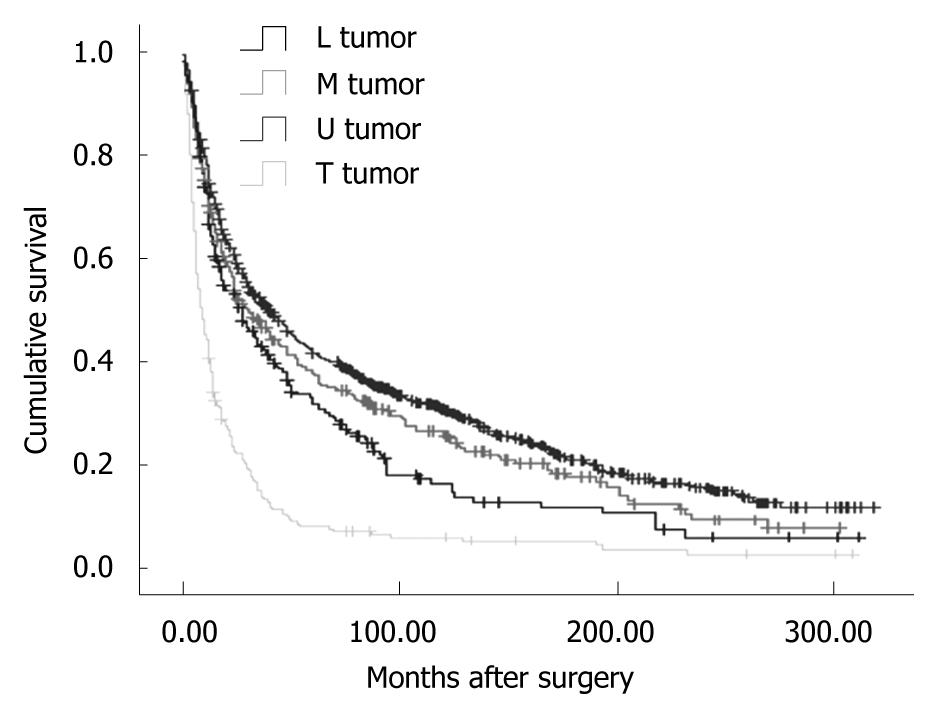
Figure 1 Disease-specific survival analysis according to cancer locations (χ2 = 190.
27, P = 0.000, Log Rank test). L tumor: Lower third tumors; M tumor: Middle third tumors; U tumor: Upper third tumors; T tumor: Tumor occupied the total stomach.
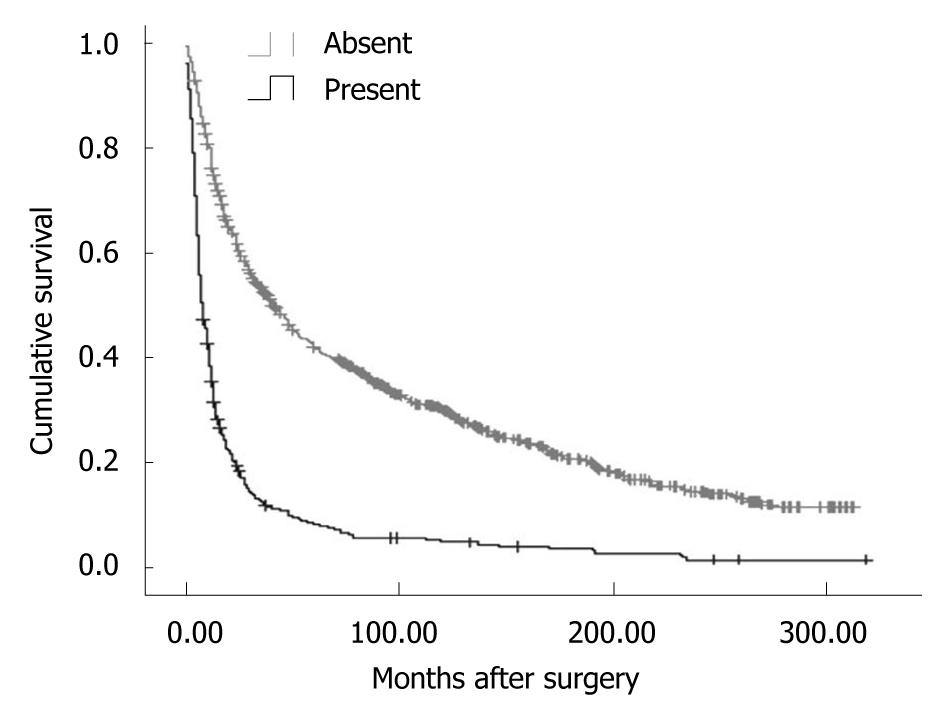
Figure 2 Disease-specific survival analysis according to distant metastasis status (χ2 = 372.
21, P = 0.000, Log Rank test).
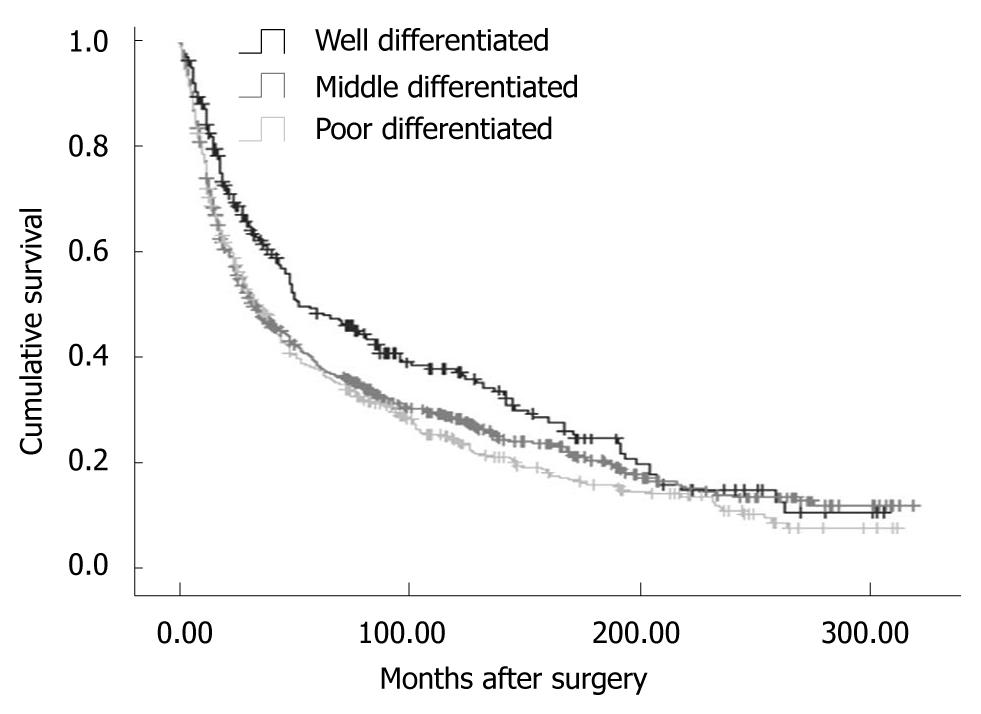
Figure 3 Disease-specific survival analysis according to histologic types (χ2 = 12.
37, P = 0.002, Log Rank test).
- Citation: Wang BB, Liu CG, Lu P, Latengbaolide A, Lu Y. Log-normal censored regression model detecting prognostic factors in gastric cancer: A study of 3018 cases. World J Gastroenterol 2011; 17(23): 2867-2872
- URL: https://www.wjgnet.com/1007-9327/full/v17/i23/2867.htm
- DOI: https://dx.doi.org/10.3748/wjg.v17.i23.2867


