Copyright
©2010 Baishideng.
World J Gastroenterol. Feb 7, 2010; 16(5): 547-553
Published online Feb 7, 2010. doi: 10.3748/wjg.v16.i5.547
Published online Feb 7, 2010. doi: 10.3748/wjg.v16.i5.547
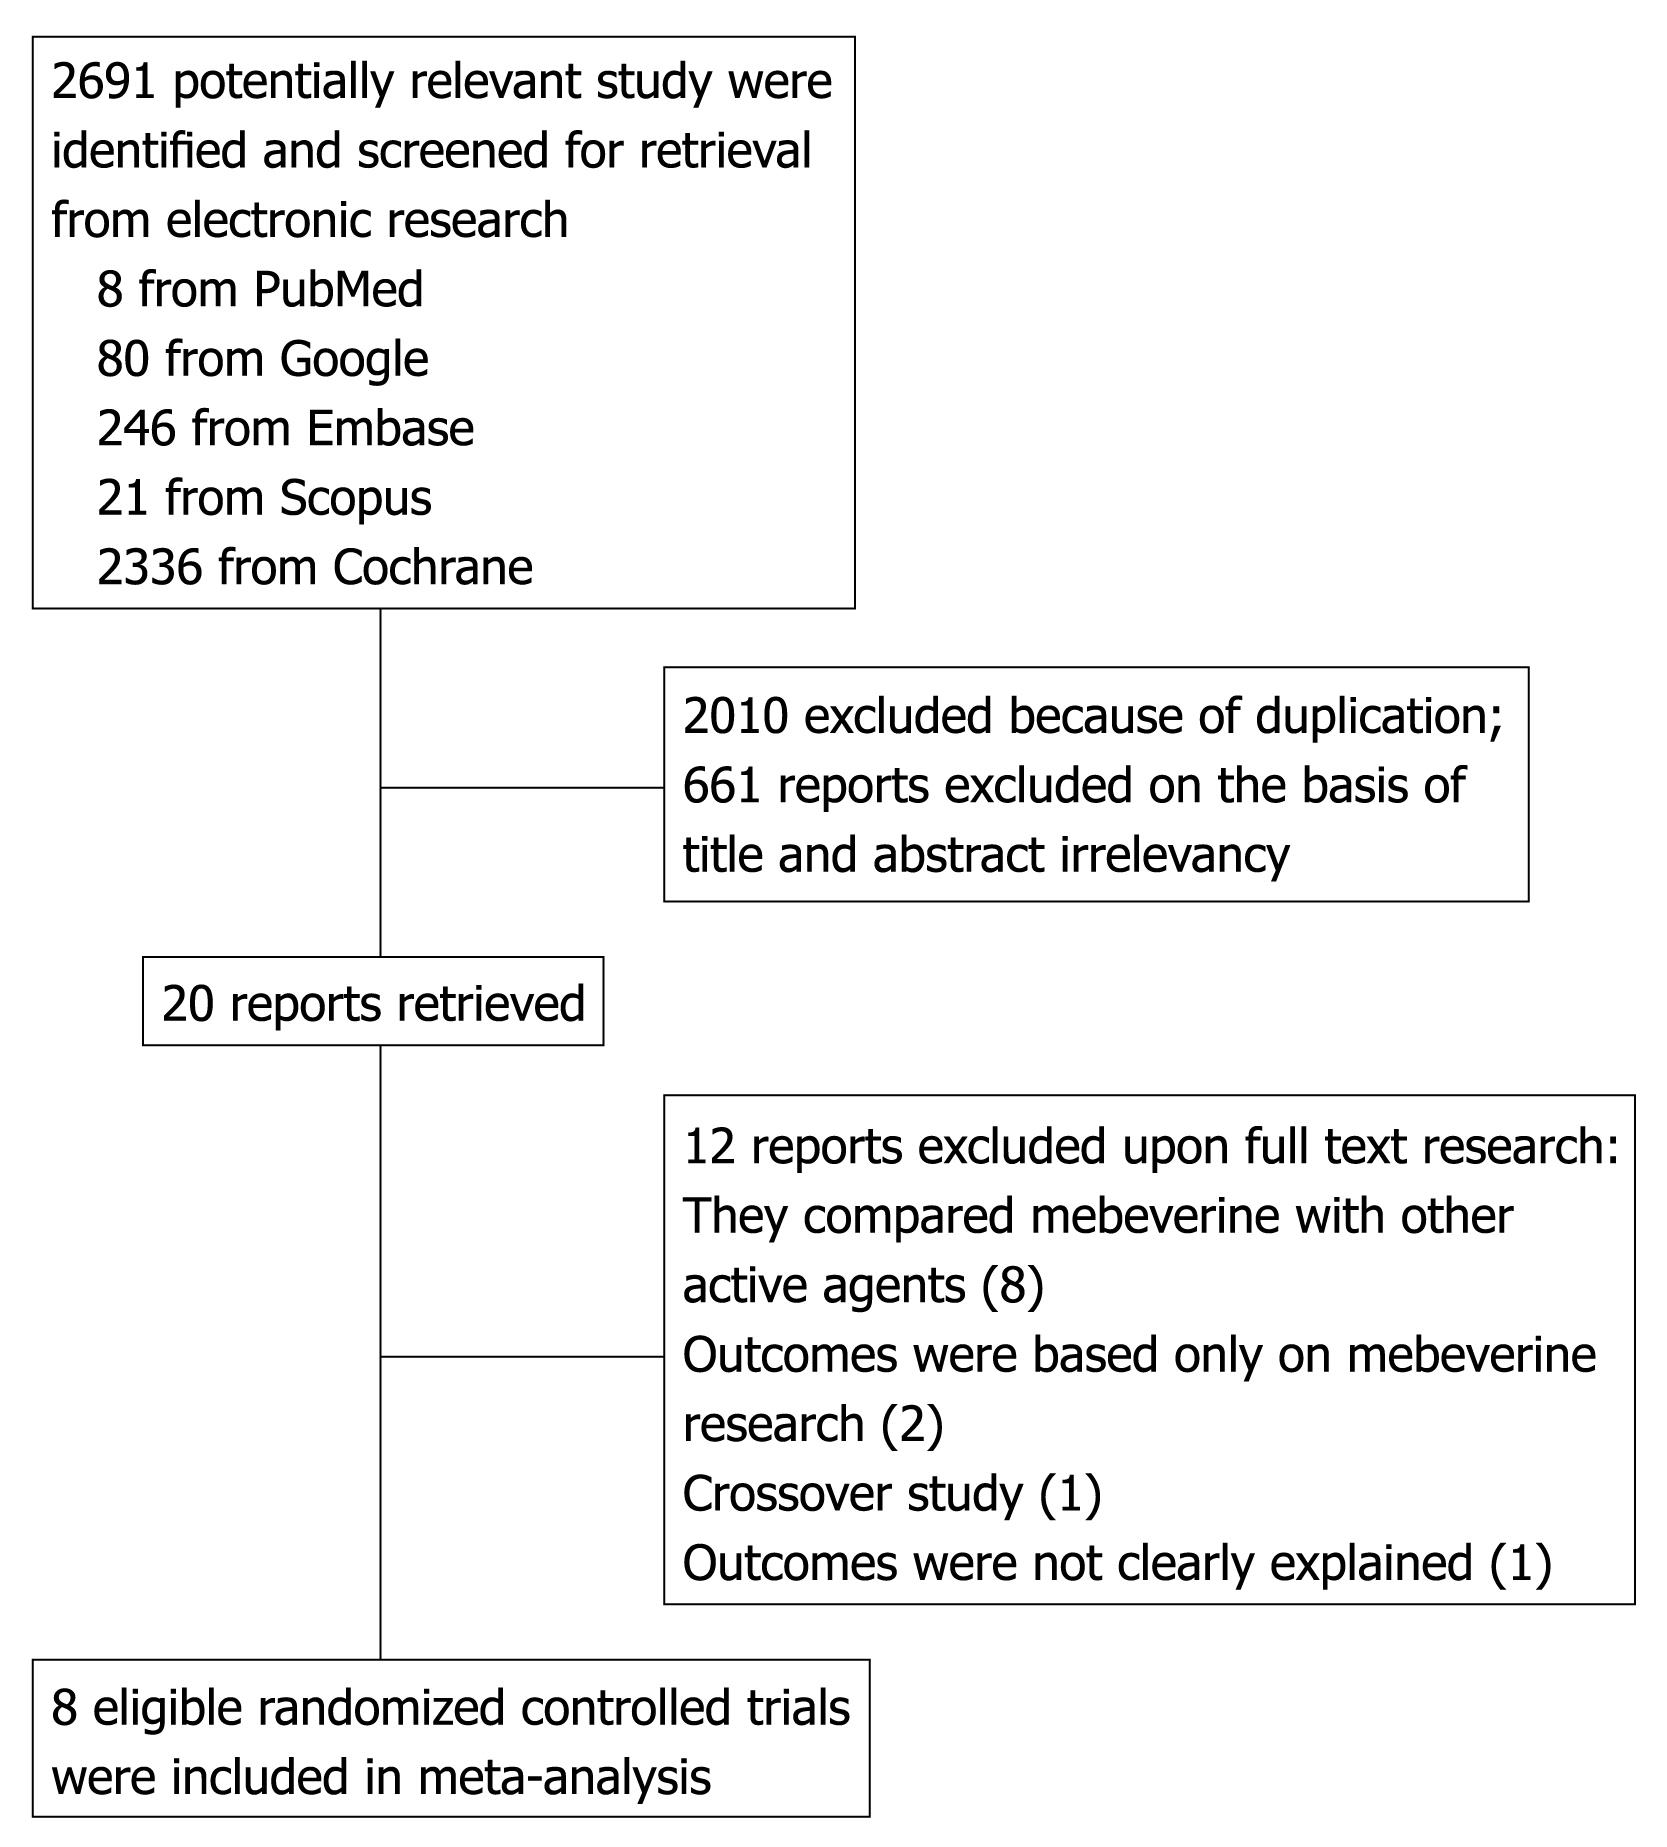
Figure 1 Flow diagram of the study selection process.
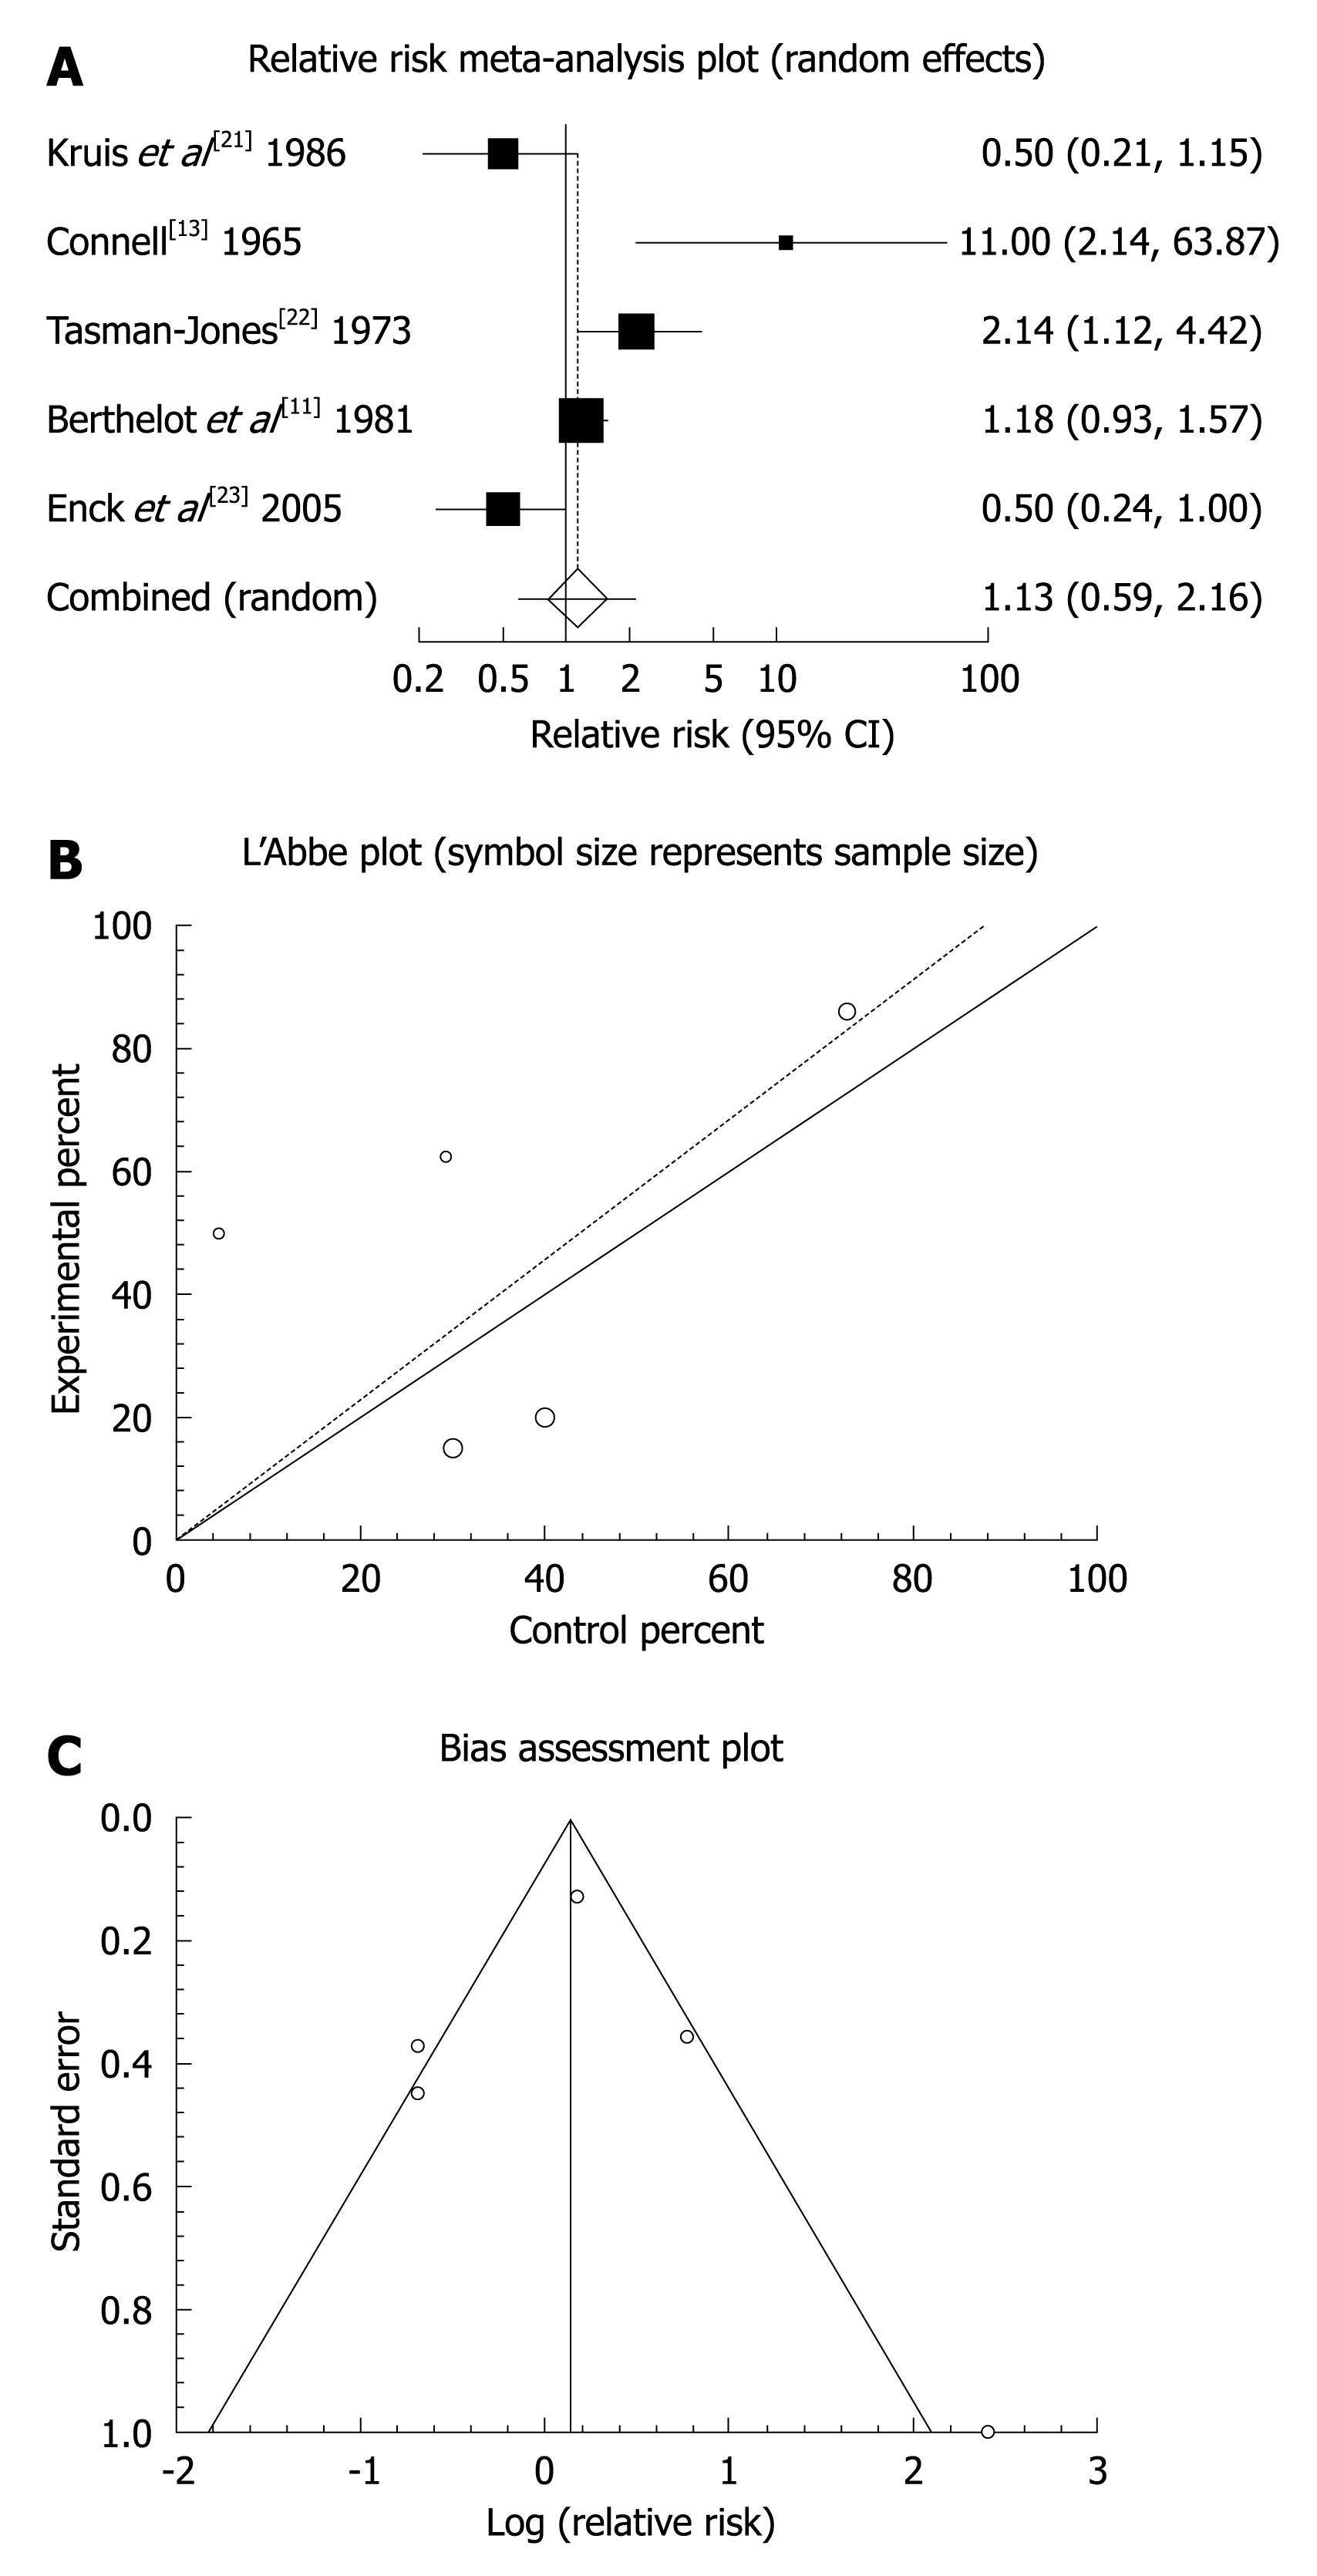
Figure 2 Individual and pooled relative risk (A), heterogeneity indicators (B), and publication bias indicators (C) for the outcome of “global or clinical improvement” in the studies comparing mebeverine vs placebo therapy.
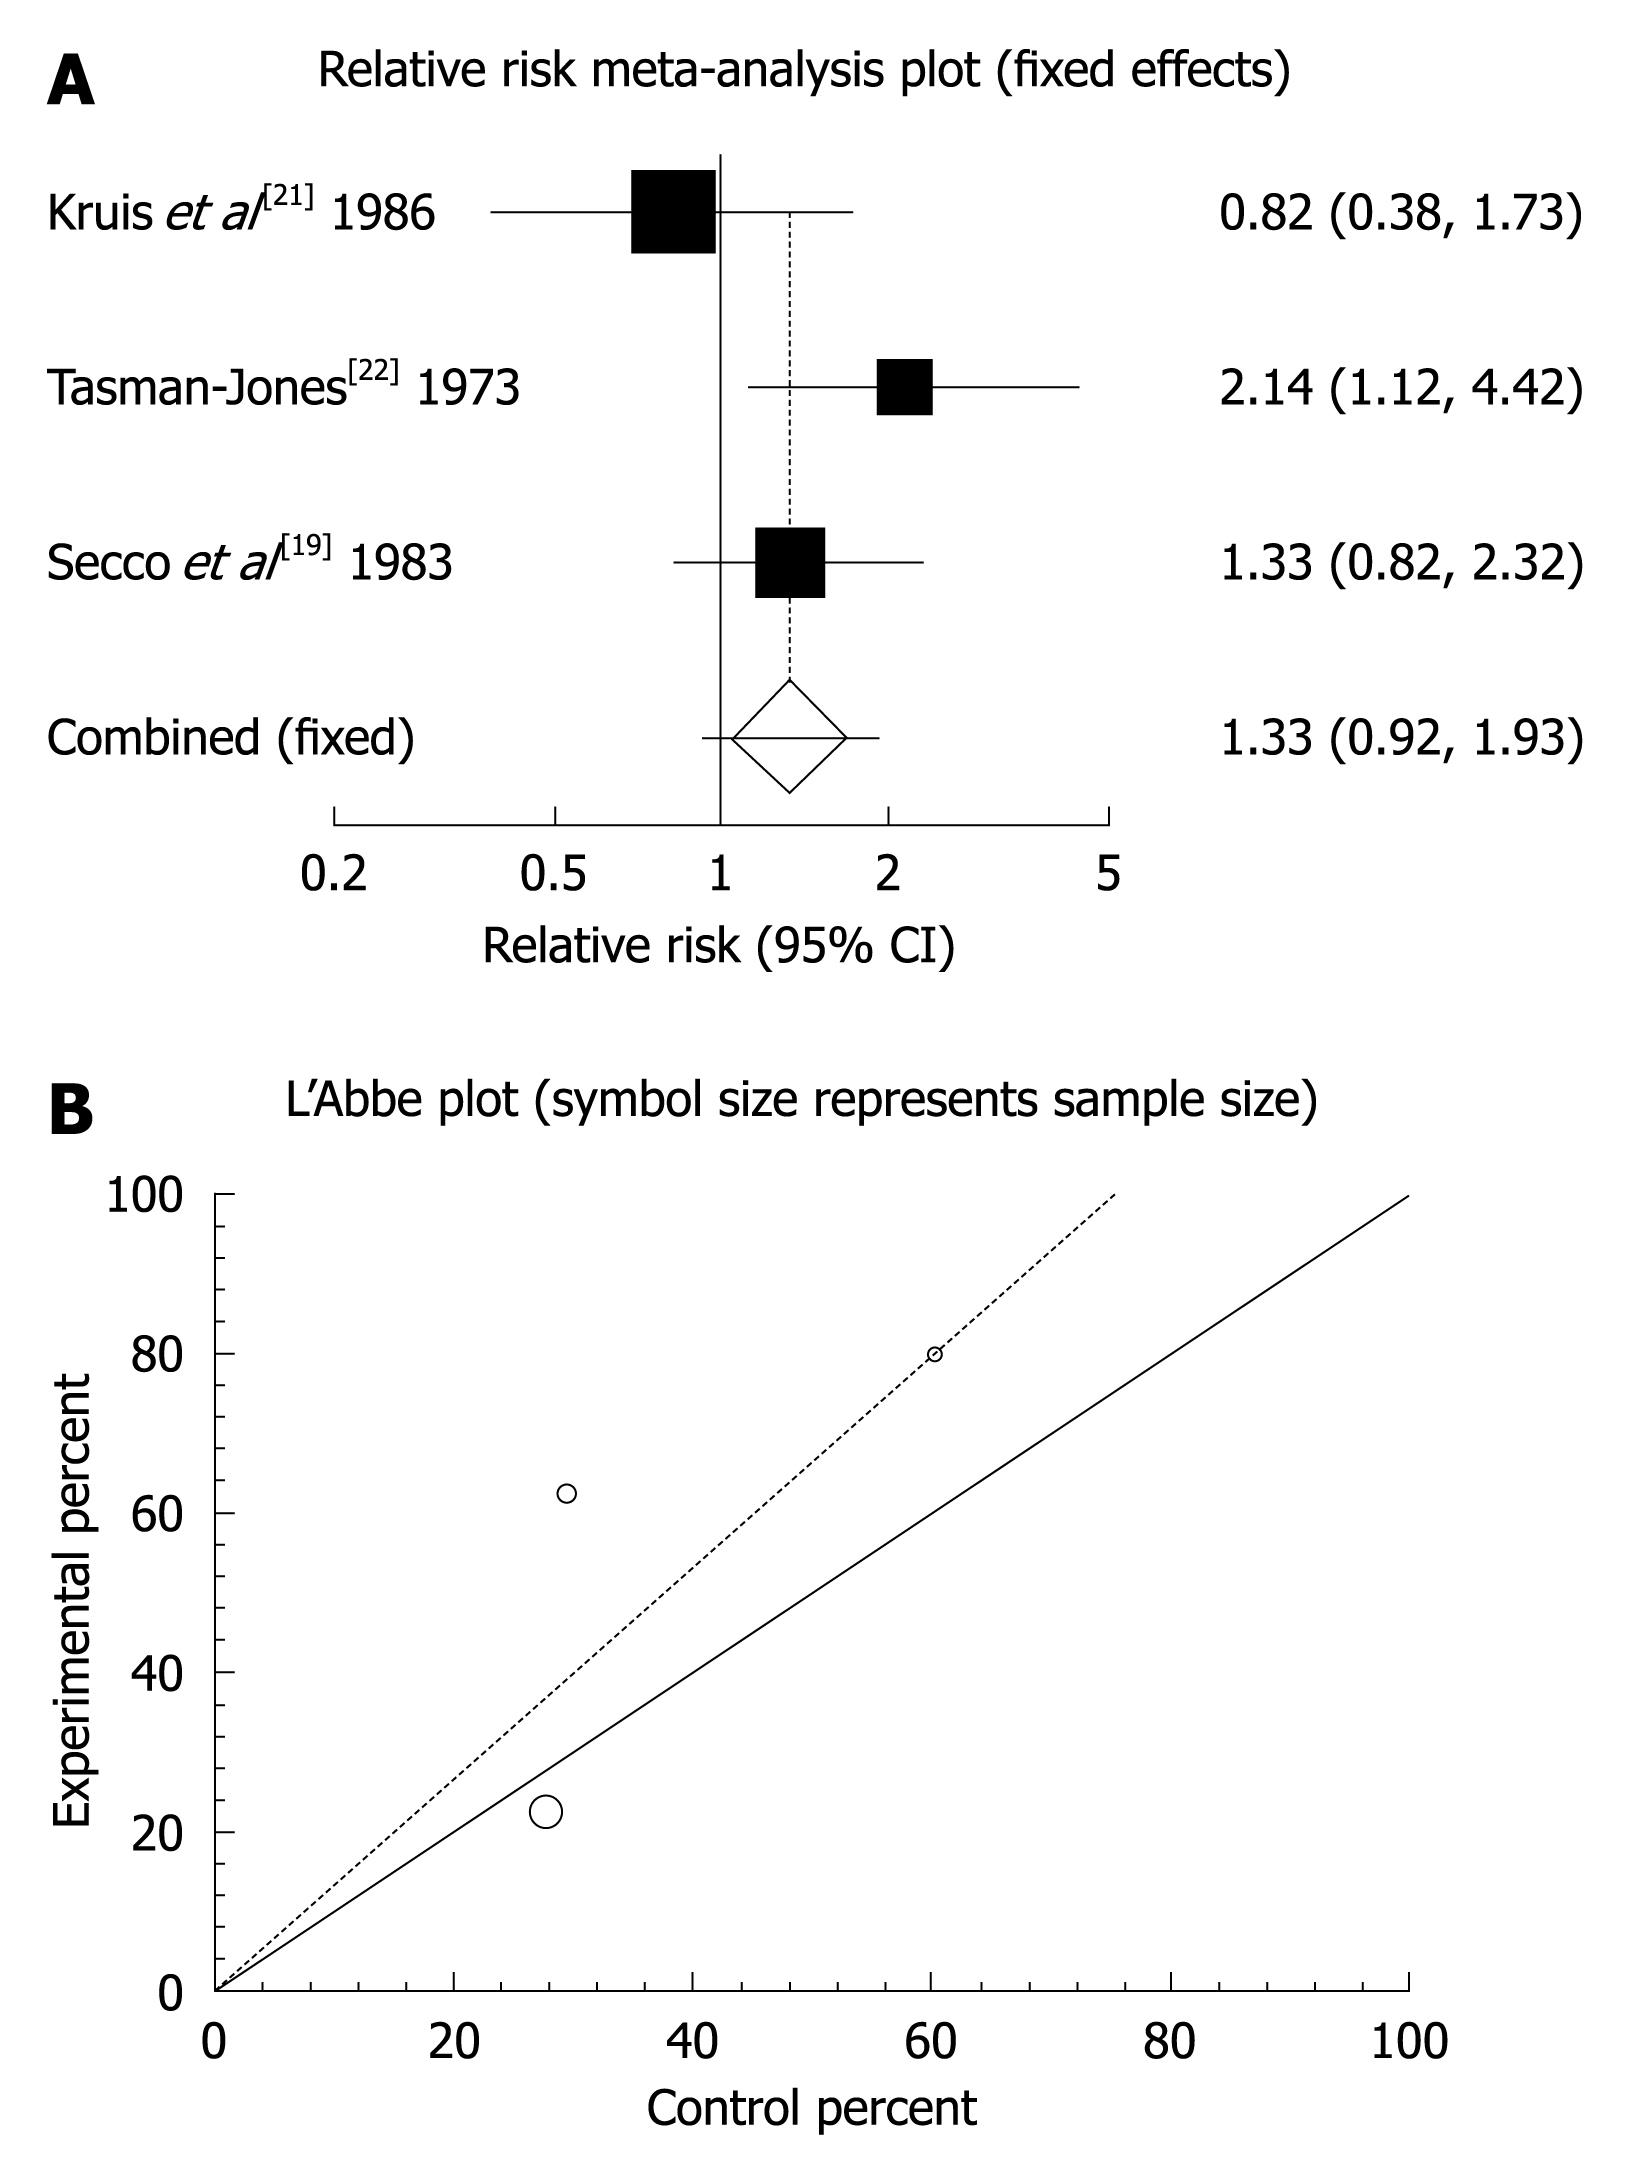
Figure 3 Individual and pooled relative risk (A) and heterogeneity indicators (B) for the outcome of “relief of abdominal pain” in the studies comparing mebeverine vs placebo therapy.
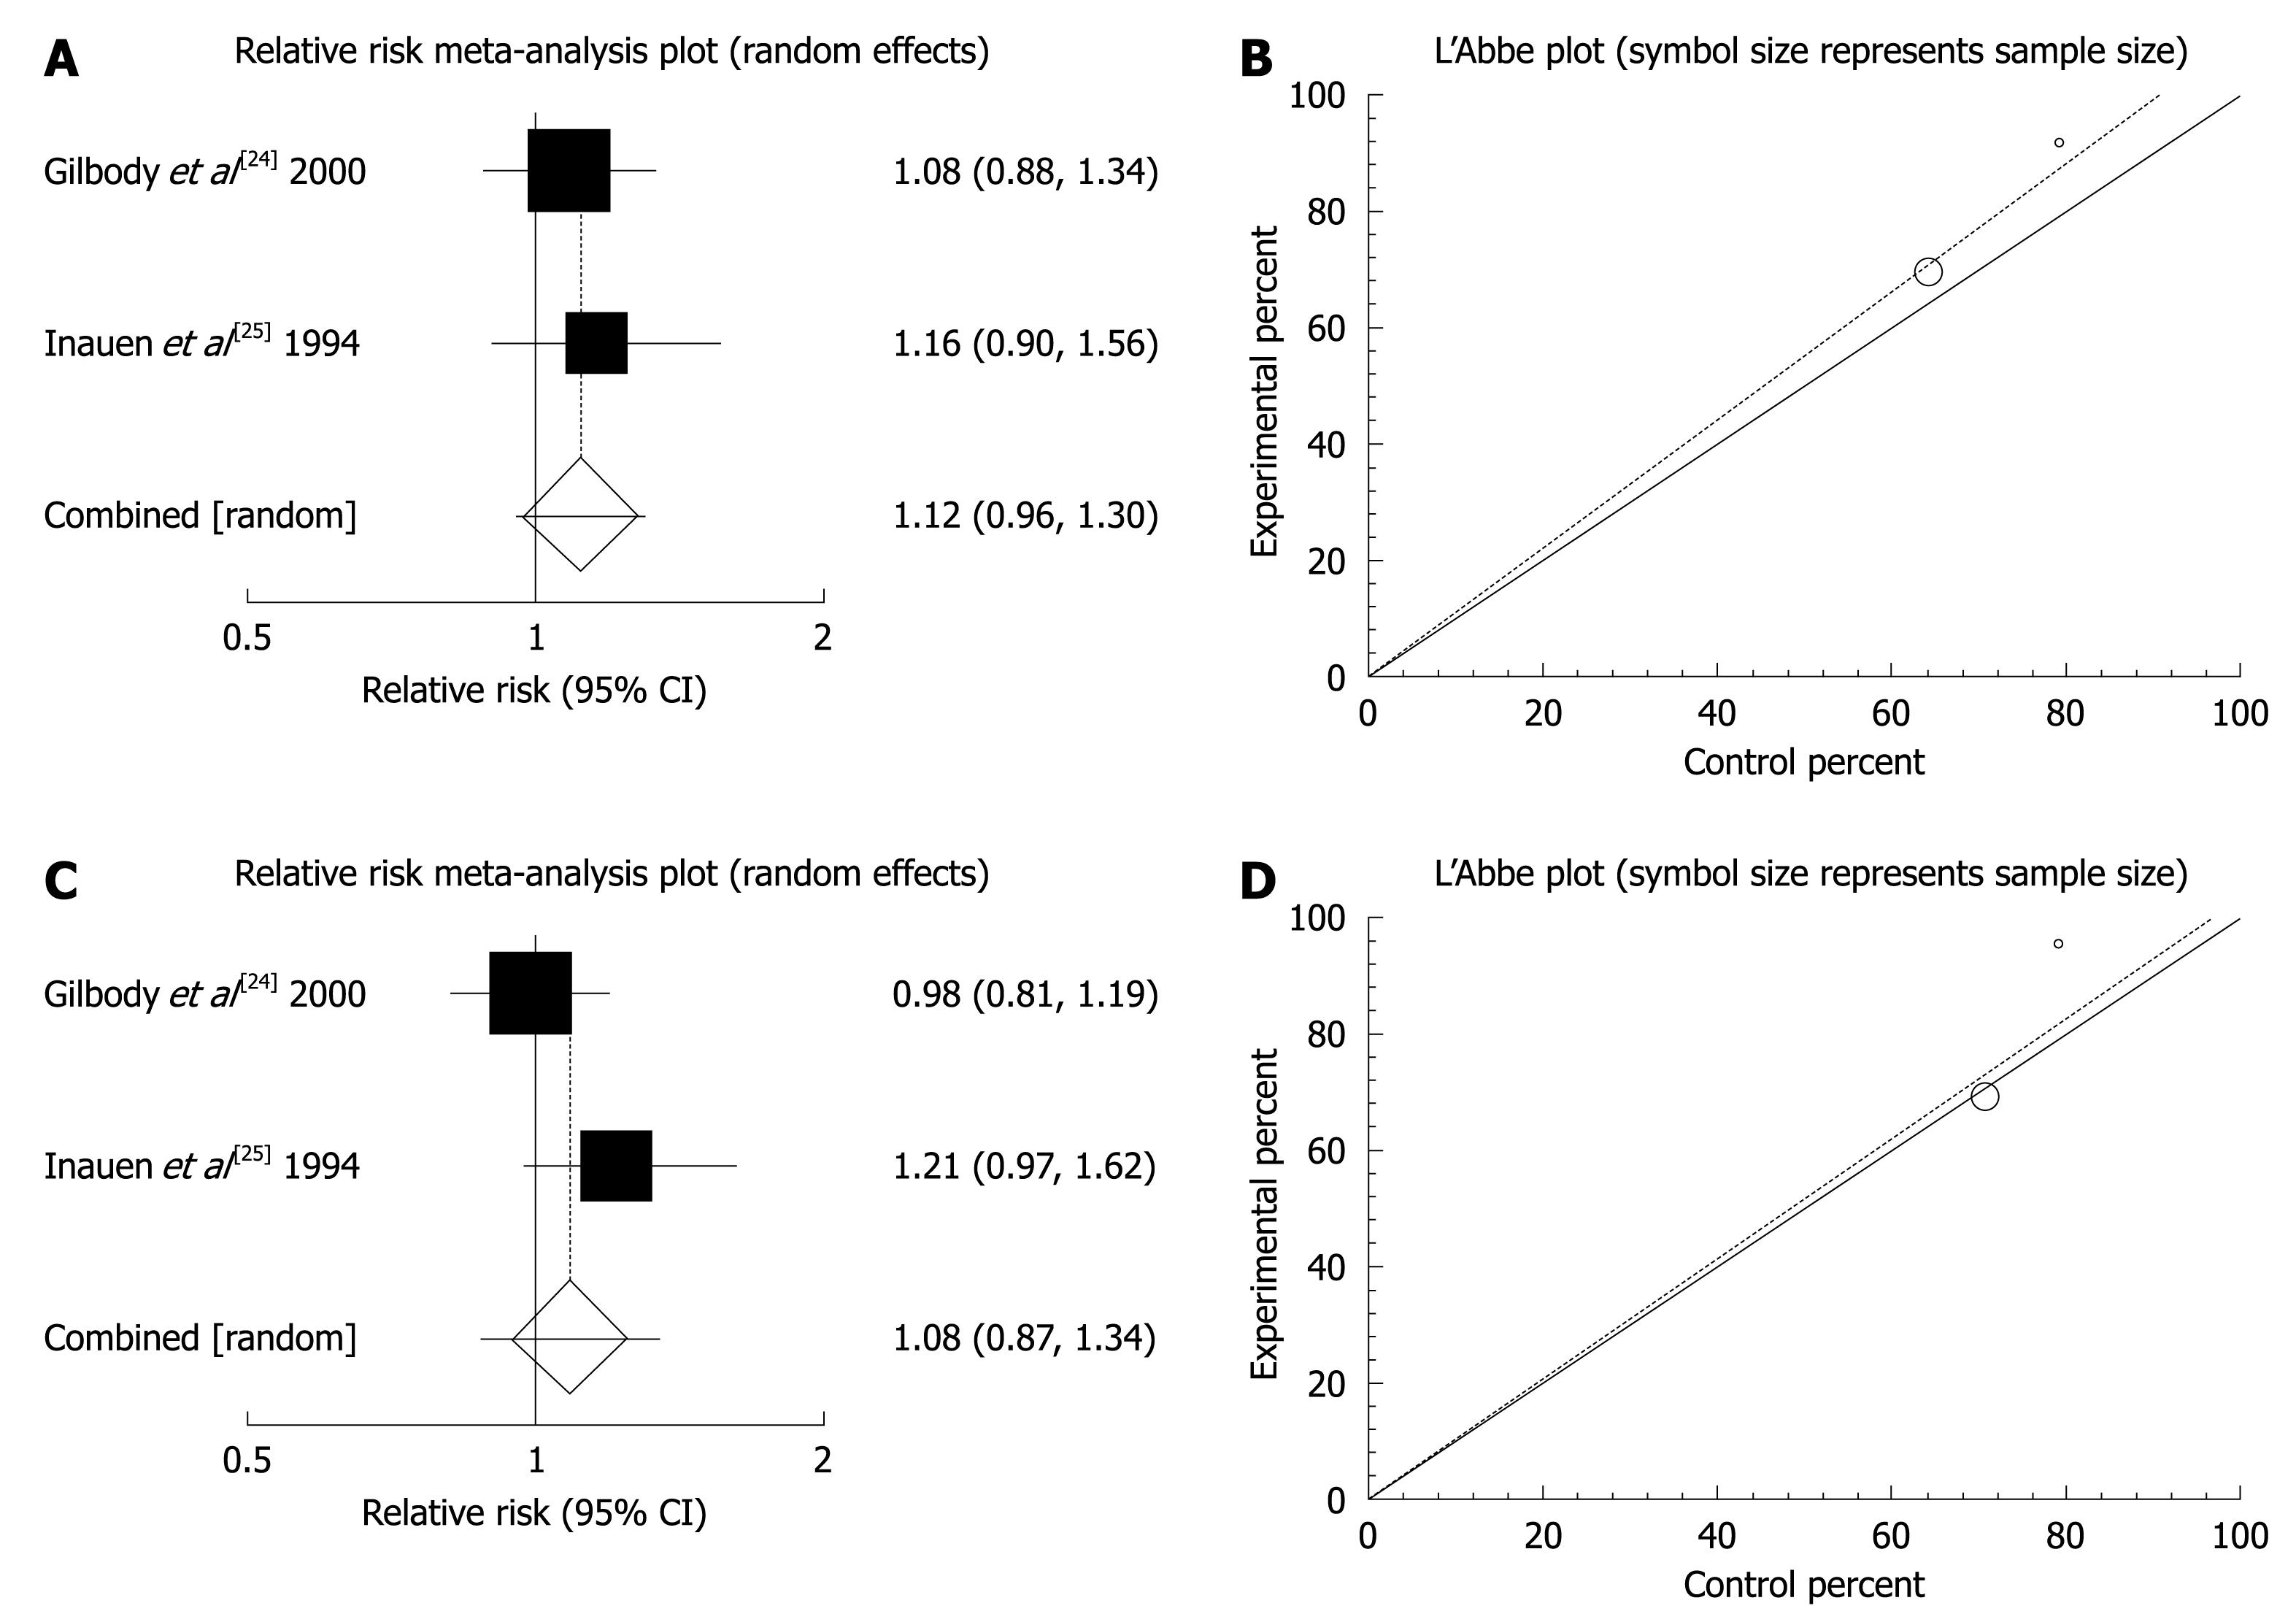
Figure 4 Individual and pooled relative risk and heterogeneity indicators for the outcome of “global or clinical improvement (A, B)” and “relief of abdominal pain (C, D)” in the studies considering mebeverine 200 mg compared to mebeverine 135 mg.
- Citation: Darvish-Damavandi M, Nikfar S, Abdollahi M. A systematic review of efficacy and tolerability of mebeverine in irritable bowel syndrome. World J Gastroenterol 2010; 16(5): 547-553
- URL: https://www.wjgnet.com/1007-9327/full/v16/i5/547.htm
- DOI: https://dx.doi.org/10.3748/wjg.v16.i5.547


