Copyright
©2010 Baishideng Publishing Group Co.
World J Gastroenterol. Nov 14, 2010; 16(42): 5306-5316
Published online Nov 14, 2010. doi: 10.3748/wjg.v16.i42.5306
Published online Nov 14, 2010. doi: 10.3748/wjg.v16.i42.5306
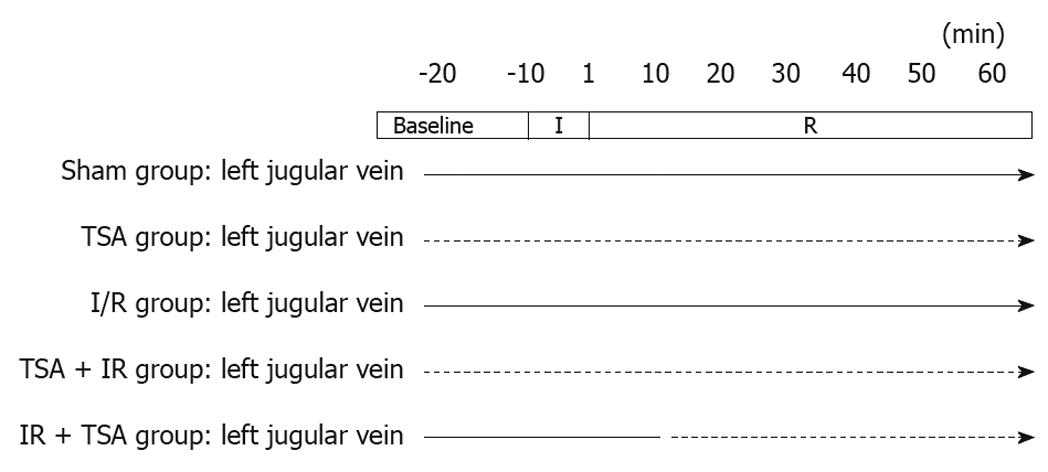
Figure 1 The protocol of the experiment.
The saline and total salvianolic acid (TSA) was continuously infused through the left jugular vein in all groups. Solid arrow represents the infusion with saline to the rat; Dotted arrow represents the infusion with TSA to the rat. -20 min represents the time point of 10 min before ischemia; -10 min represents the time point of the beginning of ischemia; 1, 10, 20, 30, 40, 50 and 60 min represent the time point of 1, 10, 20, 30, 40, 50 and 60 min after reperfusion. I: Ischemia; R: Reperfusion.
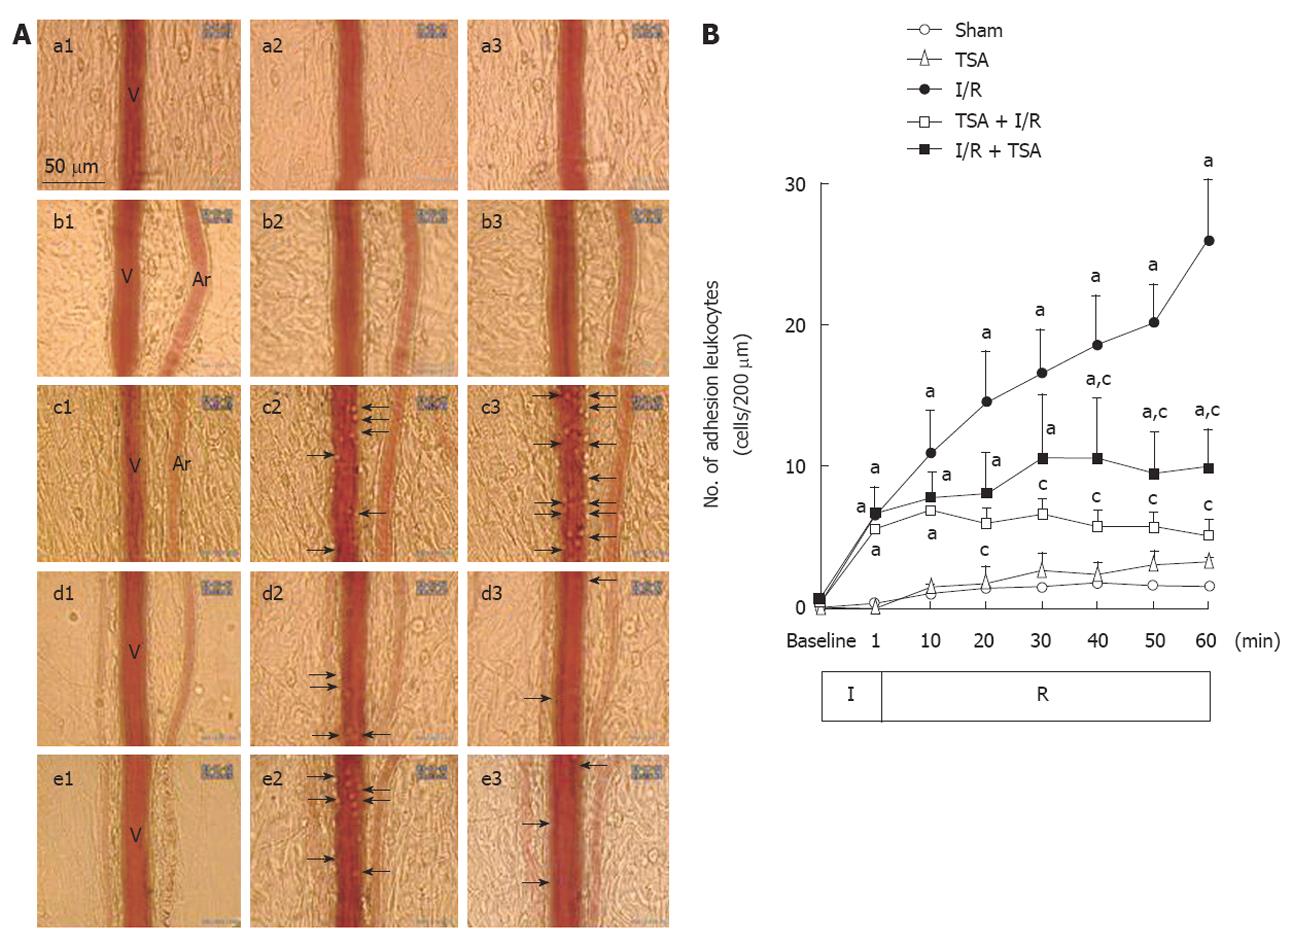
Figure 2 The effect of pre-treatment and post-treatment of total salvianolic acid on ischemia-reperfusion-induced leukocyte adhesion to the rat mesenteric venular wall.
A: Representative images illustrating the effect of pre-treatment and post-treatment of total salvianolic acid (TSA) on leukocyte adhesion to the venular wall induced by ischemia-reperfusion (I/R) in rat mesentery. a1-a3: Rat mesentery images of Sham group at baseline, 10 and 60 min, respectively. b1-b3: Rat mesentery images of TSA group at baseline, 10 and 60 min, respectively. c1-c3: Rat mesentery images of I/R group at baseline, 10 and 60 min, respectively. d1-d3: Rat mesentery images of rat mesentery of TSA + I/R group at baseline, 10 and 60 min respectively. e1-e3: Rat mesentery images of I/R + TSA group at baseline, 10 and 60 min, respectively. V: Rat mesenteric venule; Ar: Rat mesenteric arteriole; Arrows: Leukocytes adhered to the venular wall; B: Time course of changes in the number of leukocytes adherent to the mesenteric venules of rat. The number of adherent leukocytes was expressed as the number of cells per 200 μm of venules. Sham: Sham group; TSA: TSA group; I/R: I/R group; TSA + I/R: TSA plus I/R group; I/R + TSA: I/R plus TSA group. Data was expressed as mean ± SE of six animals. aP < 0.05 vs sham group; cP < 0.05 vs I/R alone.
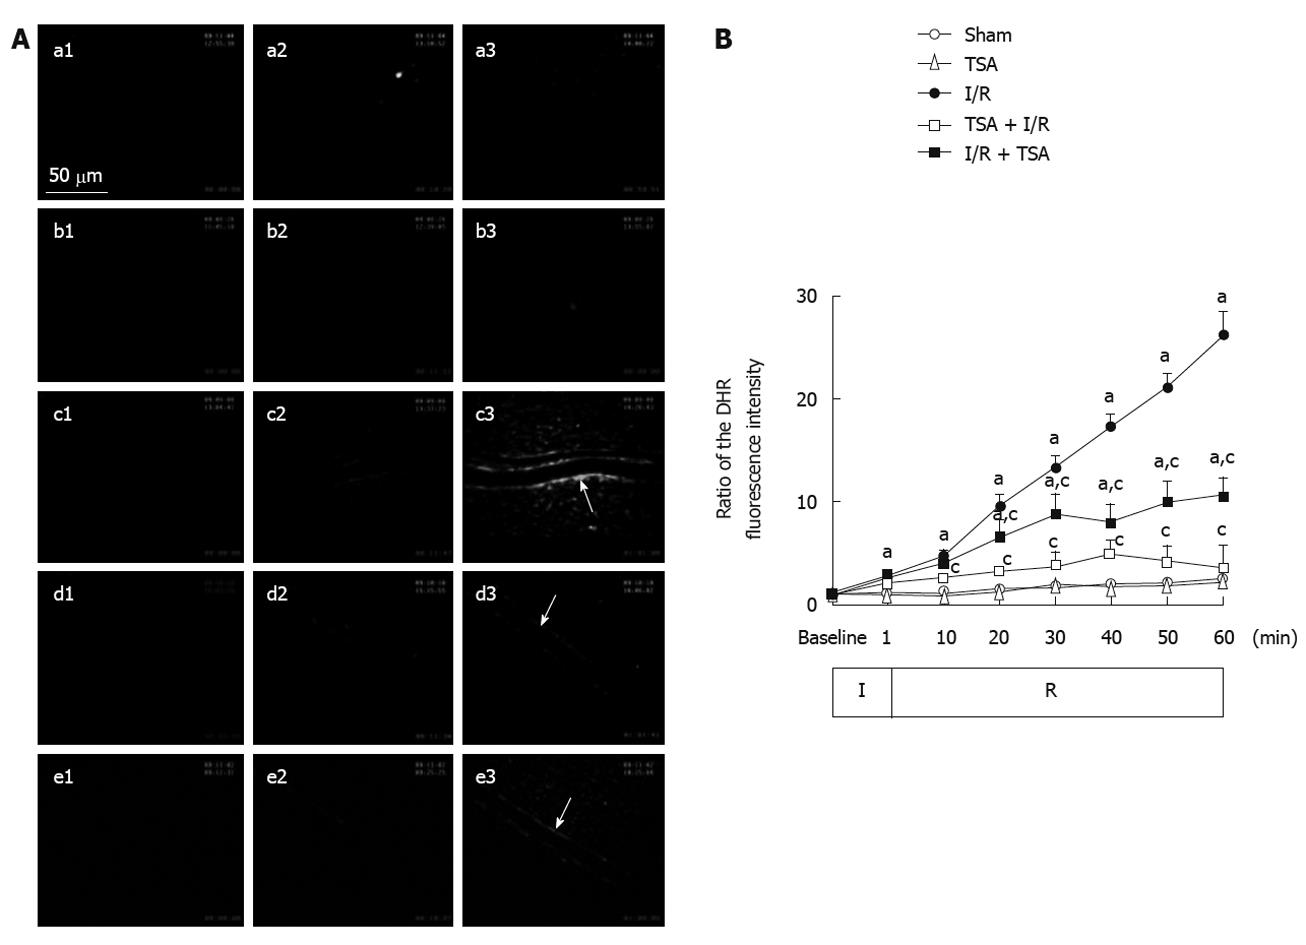
Figure 3 The effect of pre-treatment and post-treatment of total salvianolic acid on ischemia-reperfusion-induced dihydrorhodamine 123 fluorescence in rat mesenteric venular wall.
A: Representative images of the changes in fluorescence intensity of the H2O2-sensitive probe dihydrorhodamine 123 (DHR) in the rat mesenteric venular wall. a1-a3: DHR fluorescence images of rat mesentery of Sham group at baseline, 10 and 60 min, respectively. b1-b3: Fluorescence images of rat mesentery of total salvianolic acid (TSA) group at baseline, 10 and 60 min, respectively. c1-c3: Fluorescence images of rat mesentery of ischemia-reperfusion (I/R) group at baseline, 10 and 60 min, respectively. d1-d3: Fluorescence images of rat mesentery of TSA + I/R group at baseline, 10 and 60 min, respectively. e1-e3: Fluorescence images of rat mesentery of I/R + TSA group at baseline, 10 and 60 min, respectively. Baseline, no DHR fluorescence is visible in all groups (a1-e1). 60 min after I/R, prominent DHR fluorescence occurs on the wall of venule of rat mesentery (c3-e3). Arrows: DHR fluorescence on the venular wall; B: Time course of changes in DHR fluorescence ratio on the venular walls. Sham: Sham group; TSA: TSA group; I/R: I/R group; TSA + I/R: TSA plus I/R group; I/R + TSA: I/R plus TSA group. Data was expressed as mean ± SE of six animals. aP < 0.05 vs sham group; cP < 0.05 vs I/R alone.
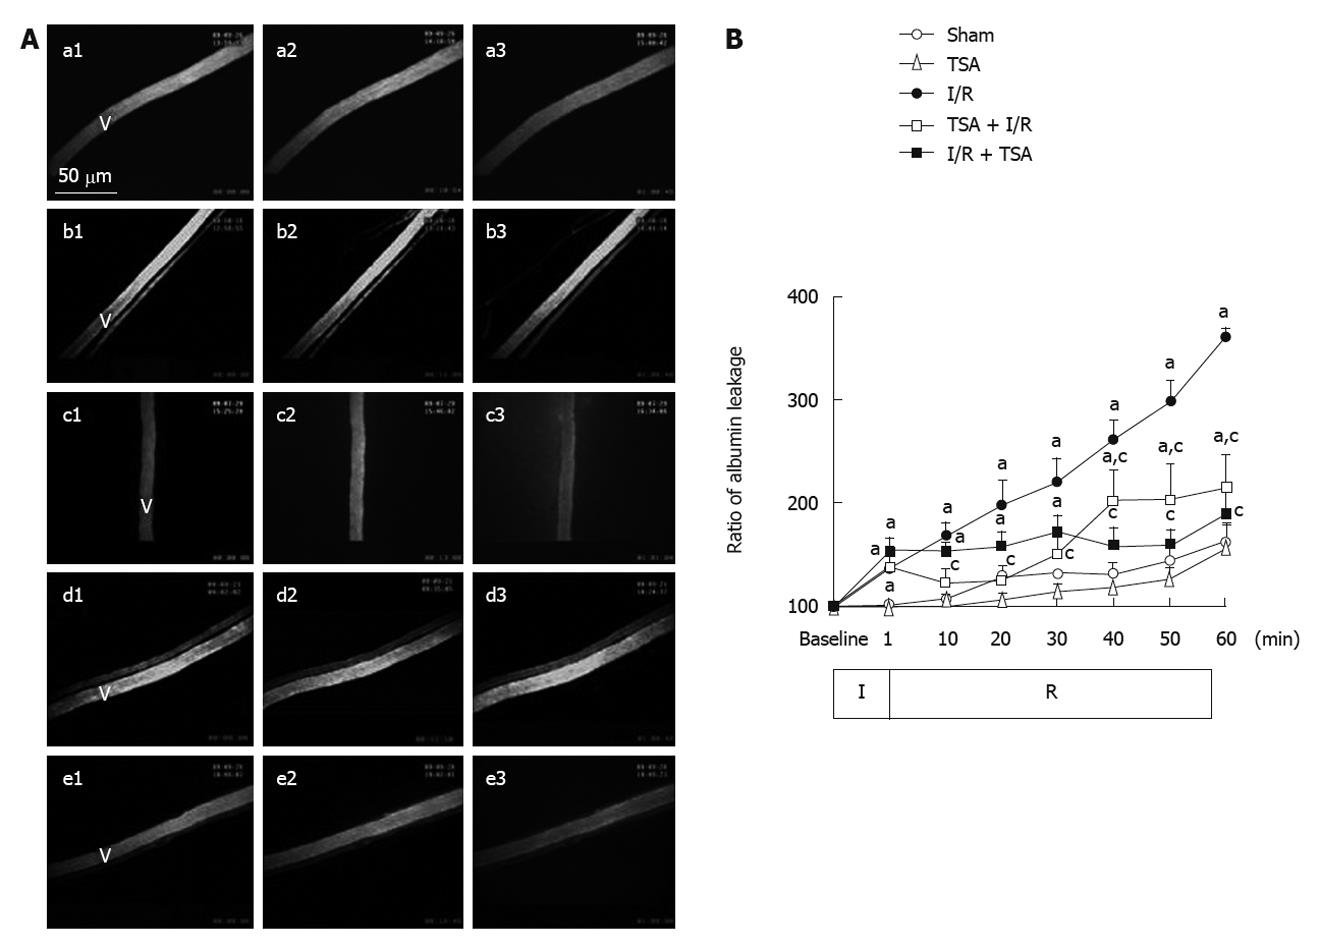
Figure 4 The effect of pre-treatment and post-treatment of total salvianolic acid on ischemia-reperfusion-induced albumin leakage from rat mesenteric venule.
A: Representative images for the effect of pre-treatment and post-treatment with total salvianolic acid (TSA) on fluorescein isothiocyanate-labeled albumin leakage from mesentery venule. a1-a3: Fluorescence images of rat mesentery of Sham group at baseline, 10 and 60 min, respectively. b1-b3: Fluorescence images of rat mesentery of TSA group at baseline, 10 and 60 min, respectively. c1-c3: Fluorescence images of rat mesentery of ischemia-reperfusion (I/R) group at baseline, 10 and 60 min, respectively. d1-d3: Fluorescence images of rat mesentery of TSA + I/R group at baseline, 10 and 60 min, respectively. e1-e3: Fluorescence images of rat mesentery of I/R + TSA group at baseline, 10 and 60 min, respectively. V: Rat mesenteric venule; B: Times course of changes in the albumin leakage from mesentery venules. Sham: Sham group; TSA: TSA group; I/R: I/R group; TSA + I/R: TSA plus I/R group; I/R + TSA: I/R plus TSA group. Data was expressed as mean ± SE of six animals. aP < 0.05 vs sham group; cP < 0.05 vs I/R alone.
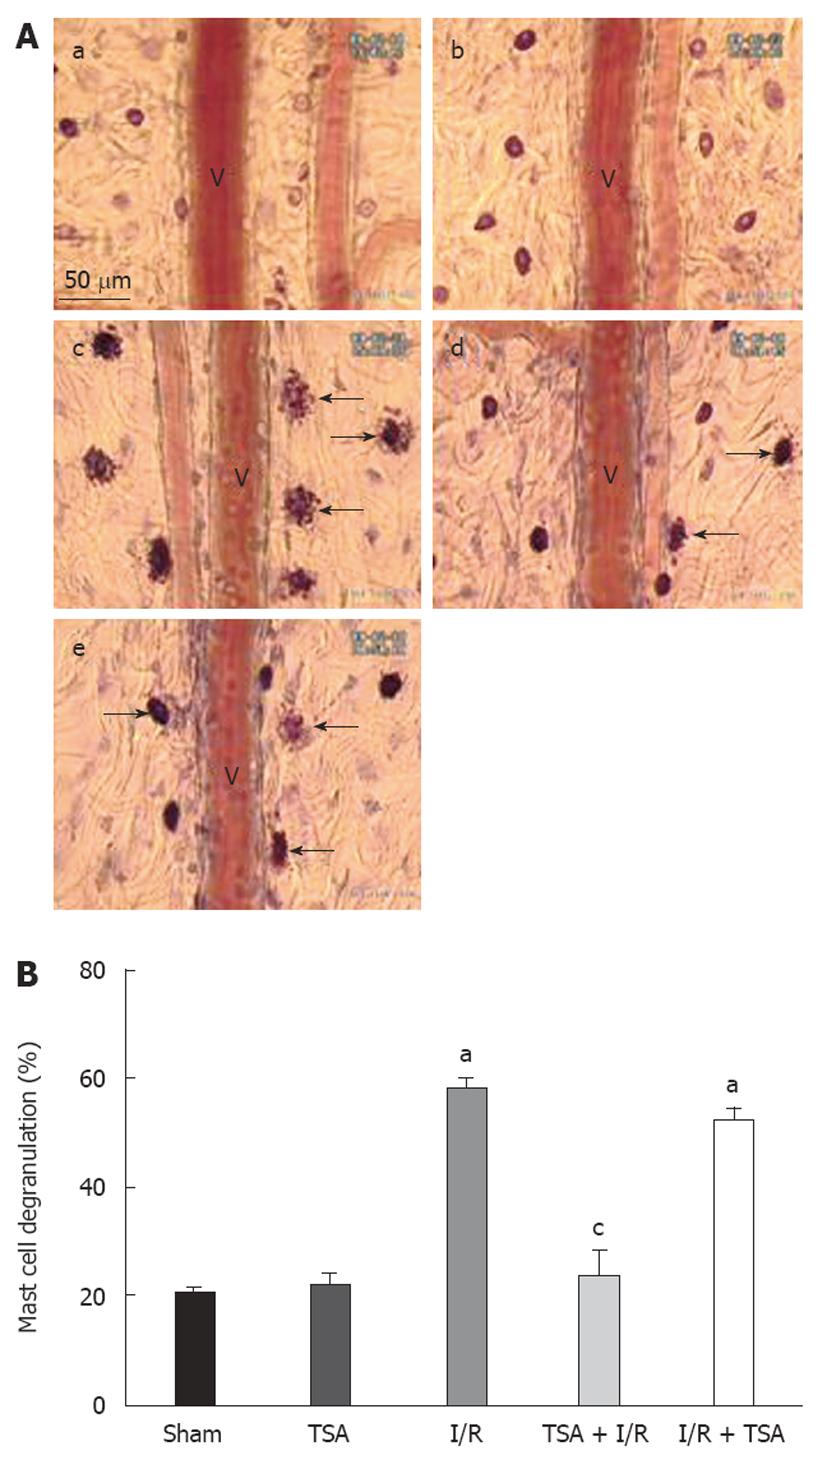
Figure 5 Effect of total salvianolic acid on mast cell degranulation induced by ischemia-reperfusion in rat mesentery.
A: Representative image of degranulated mast cells in the mesentery after ischemia-reperfusion (I/R). a: Mast cells of Sham group; b: Mast cells of total salvianolic acid (TSA) group; c: Mast cells of I/R group; d: Mast cells of TSA + I/R group; e: Mast cells of I/R + TSA group. V: Rat mesenteric venule; Arrows: degranulated mast cells. B: A quantitative evaluation of mast cell degranulation along venules in Sham group, TSA group, I/R group, TSA + I/R group, I/R + TSA group. Data was expressed as mean ± SE of six animals. aP < 0.05 vs sham group; cP < 0.05 vs I/R alone.
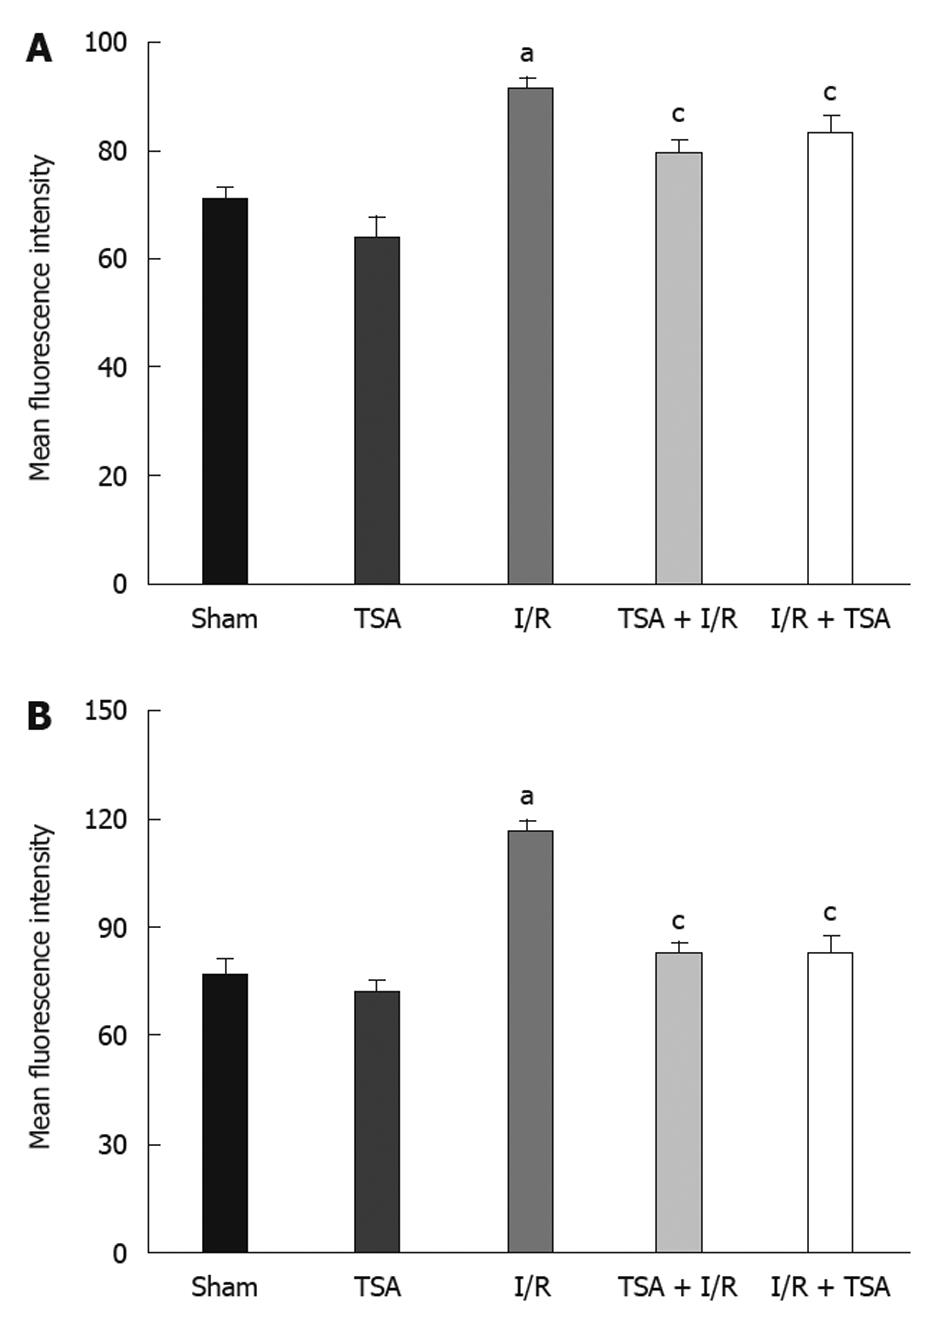
Figure 6 Effect of total salvianolic acid on ischemia-reperfusion-induced expression of adhesion molecules CD18 (A) and CD11b (B) on rat neutrophils.
The expression of adhesion molecules is presented as fluorescence intensity on ordinate. Data was expressed as mean ± SE of six animals. aP < 0.05 vs sham group; cP < 0.05 vs ischemia-reperfusion (I/R) alone.
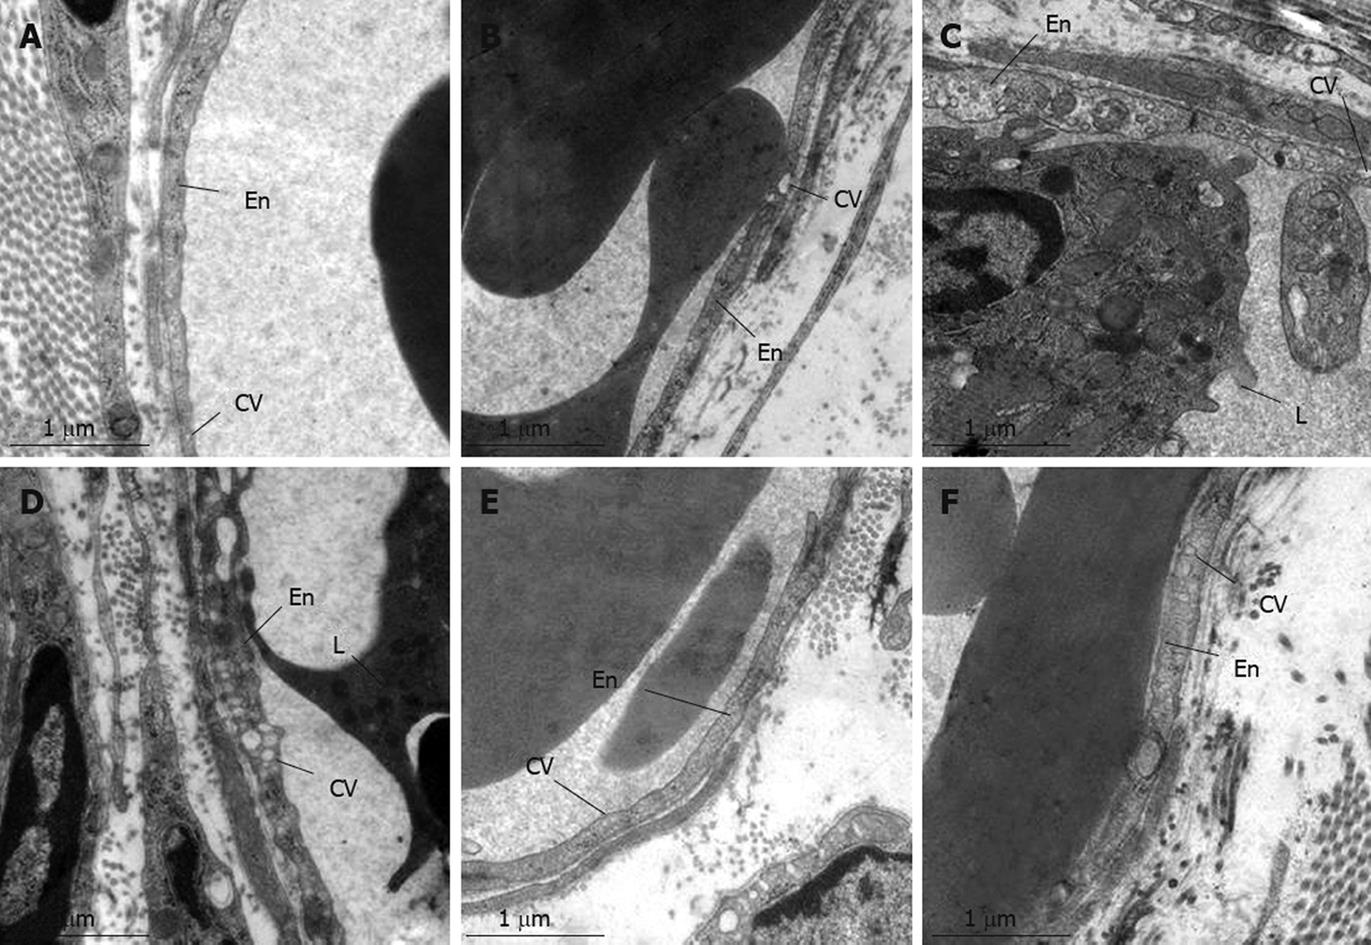
Figure 7 Representative electron micrographs of post-capillary venules of rat mesentery.
A: Sham group; B: Total salvianolic acid (TSA) group; C: 10 min after reperfusion; D: 60 min after reperfusion; E: TSA + ischemia-reperfusion (I/R) group; F: I/R + TSA group. En: Endothelial cell; CV: Caveolae; L: Leukocyte.
- Citation: Wang MX, Liu YY, Hu BH, Wei XH, Chang X, Sun K, Fan JY, Liao FL, Wang CS, Zheng J, Han JY. Total salvianolic acid improves ischemia-reperfusion-induced microcirculatory disturbance in rat mesentery. World J Gastroenterol 2010; 16(42): 5306-5316
- URL: https://www.wjgnet.com/1007-9327/full/v16/i42/5306.htm
- DOI: https://dx.doi.org/10.3748/wjg.v16.i42.5306


