Copyright
©2010 Baishideng Publishing Group Co.
World J Gastroenterol. Sep 14, 2010; 16(34): 4281-4290
Published online Sep 14, 2010. doi: 10.3748/wjg.v16.i34.4281
Published online Sep 14, 2010. doi: 10.3748/wjg.v16.i34.4281
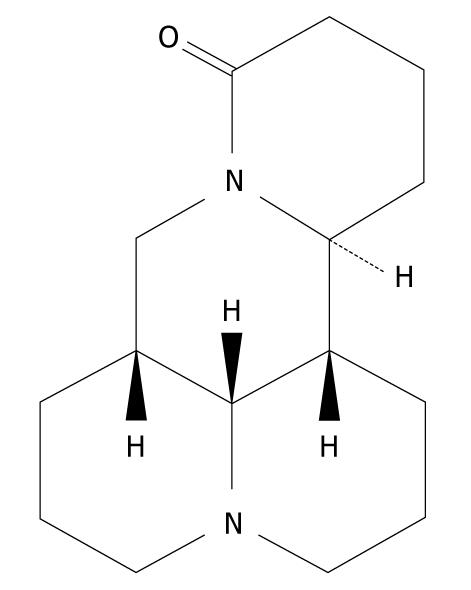
Figure 1 Chemical structure of matrine with a molecular formula of C15H24N2O and a molecular weight of 248.
37.
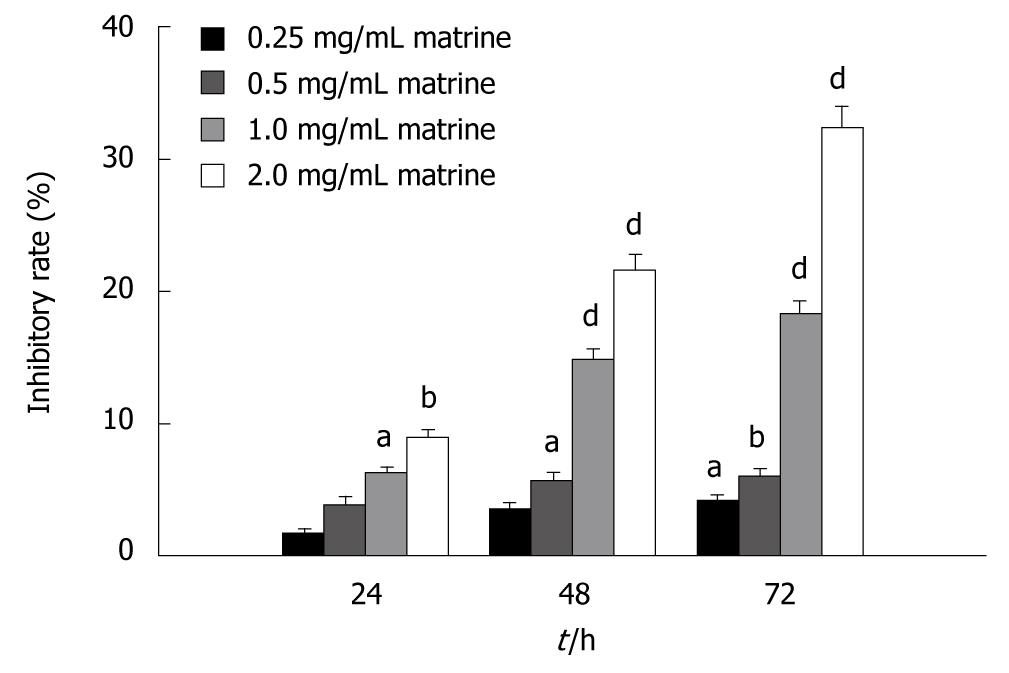
Figure 2 MTT assay showing the inhibitory effect of matrine on growth of HepG2 cells.
HepG2 cells were treated with matrine at the concentration of 0.25, 0.5, 1.0 and 2.0 mg/mL, respectively for 24, 48 and 72 h. Matrine inhibited the growth of HepG2 cells in a dose- and time-dependent manner. aP < 0.05, bP < 0.01, dP < 0.001 vs control group.
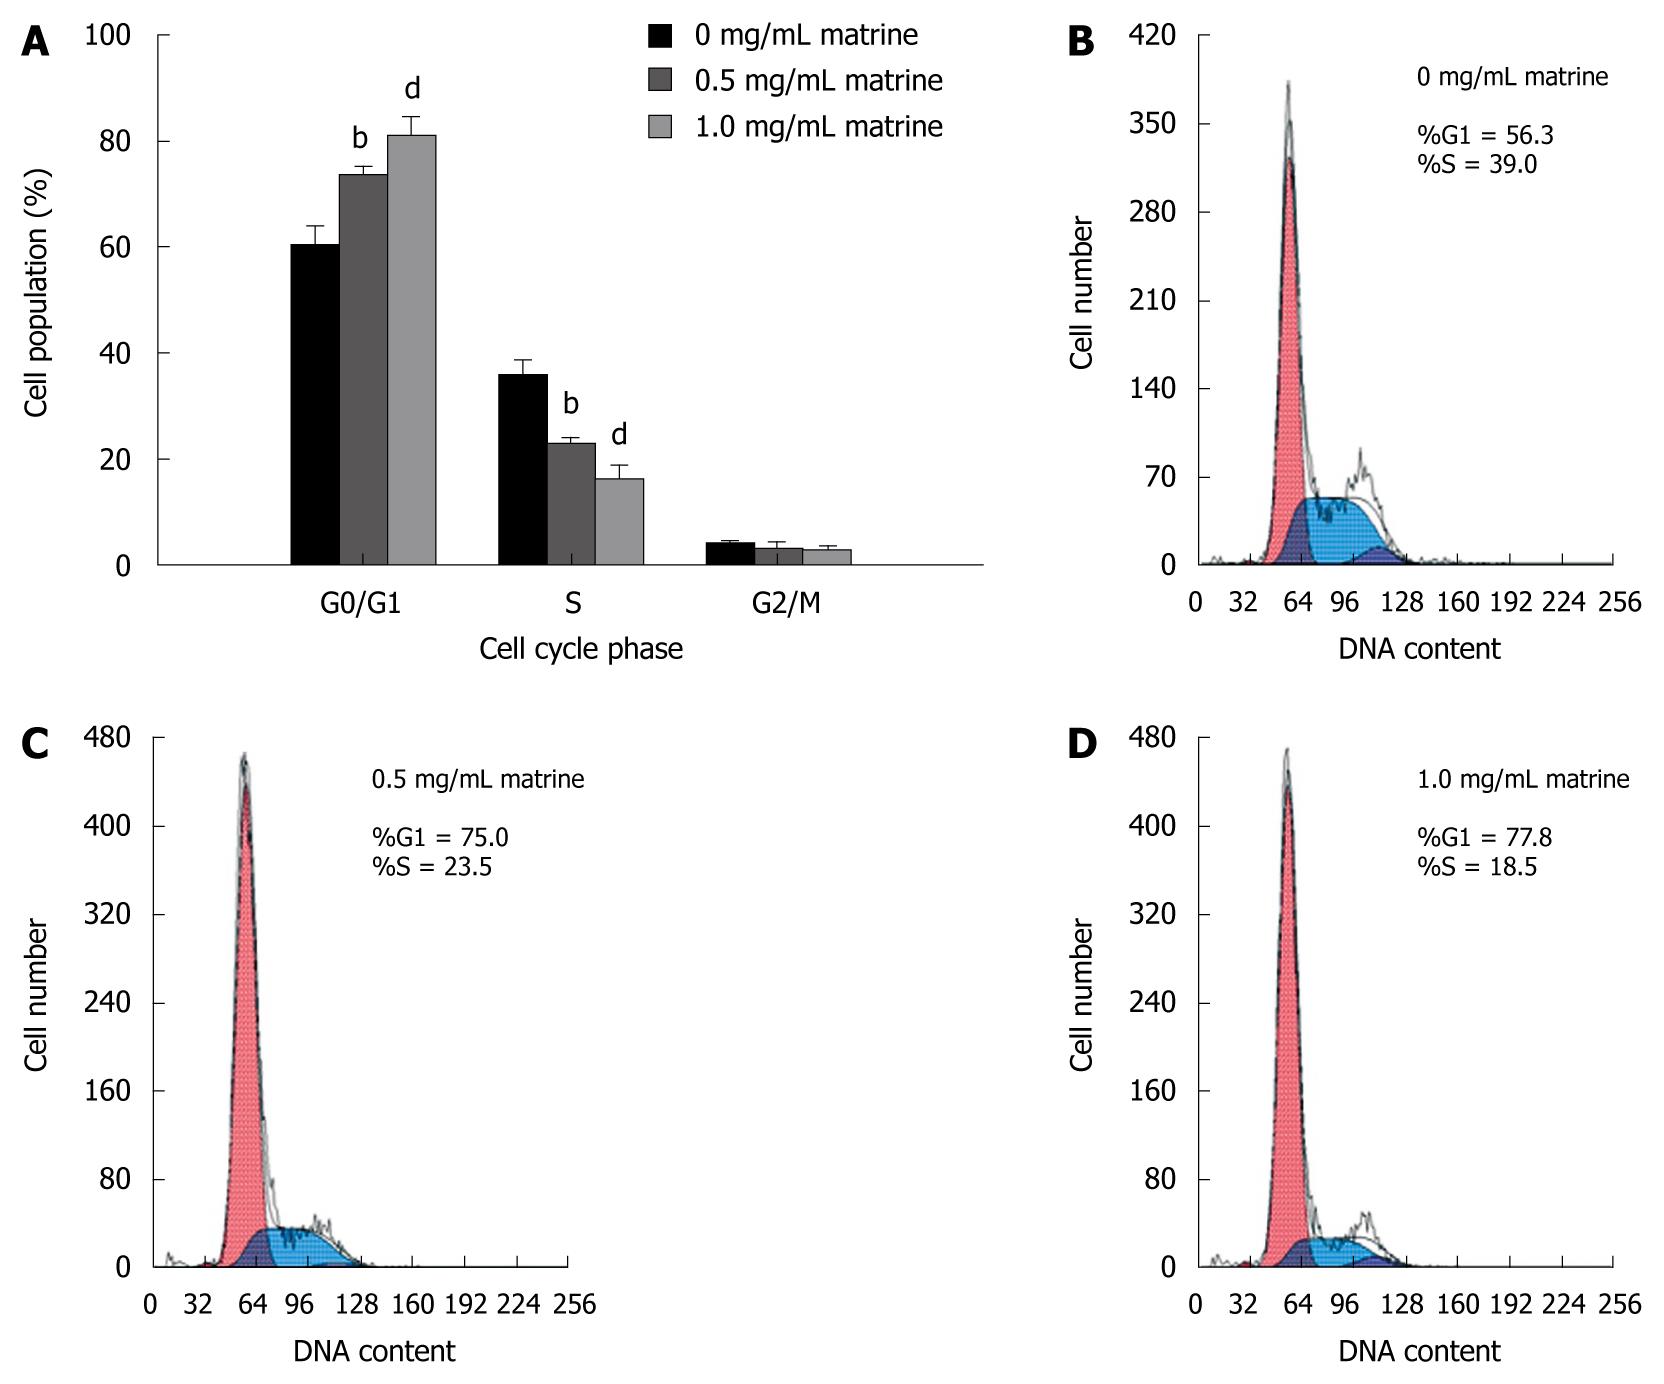
Figure 3 Effect of matrine on cell cycle distribution in HepG2 cells.
A: Matrine treatment significantly increased the proportion of HepG2 cells in G0/G1 phase while decreased the number of HepG2 cells in the S phase. Results were expressed as mean ± SD (n = 3); B-D: Histograms of HepG2 cells incubated with matrine at the concentrations of 0, 0.5 and 1.0 mg/mL. bP < 0.01, dP <0.001 vs control group.
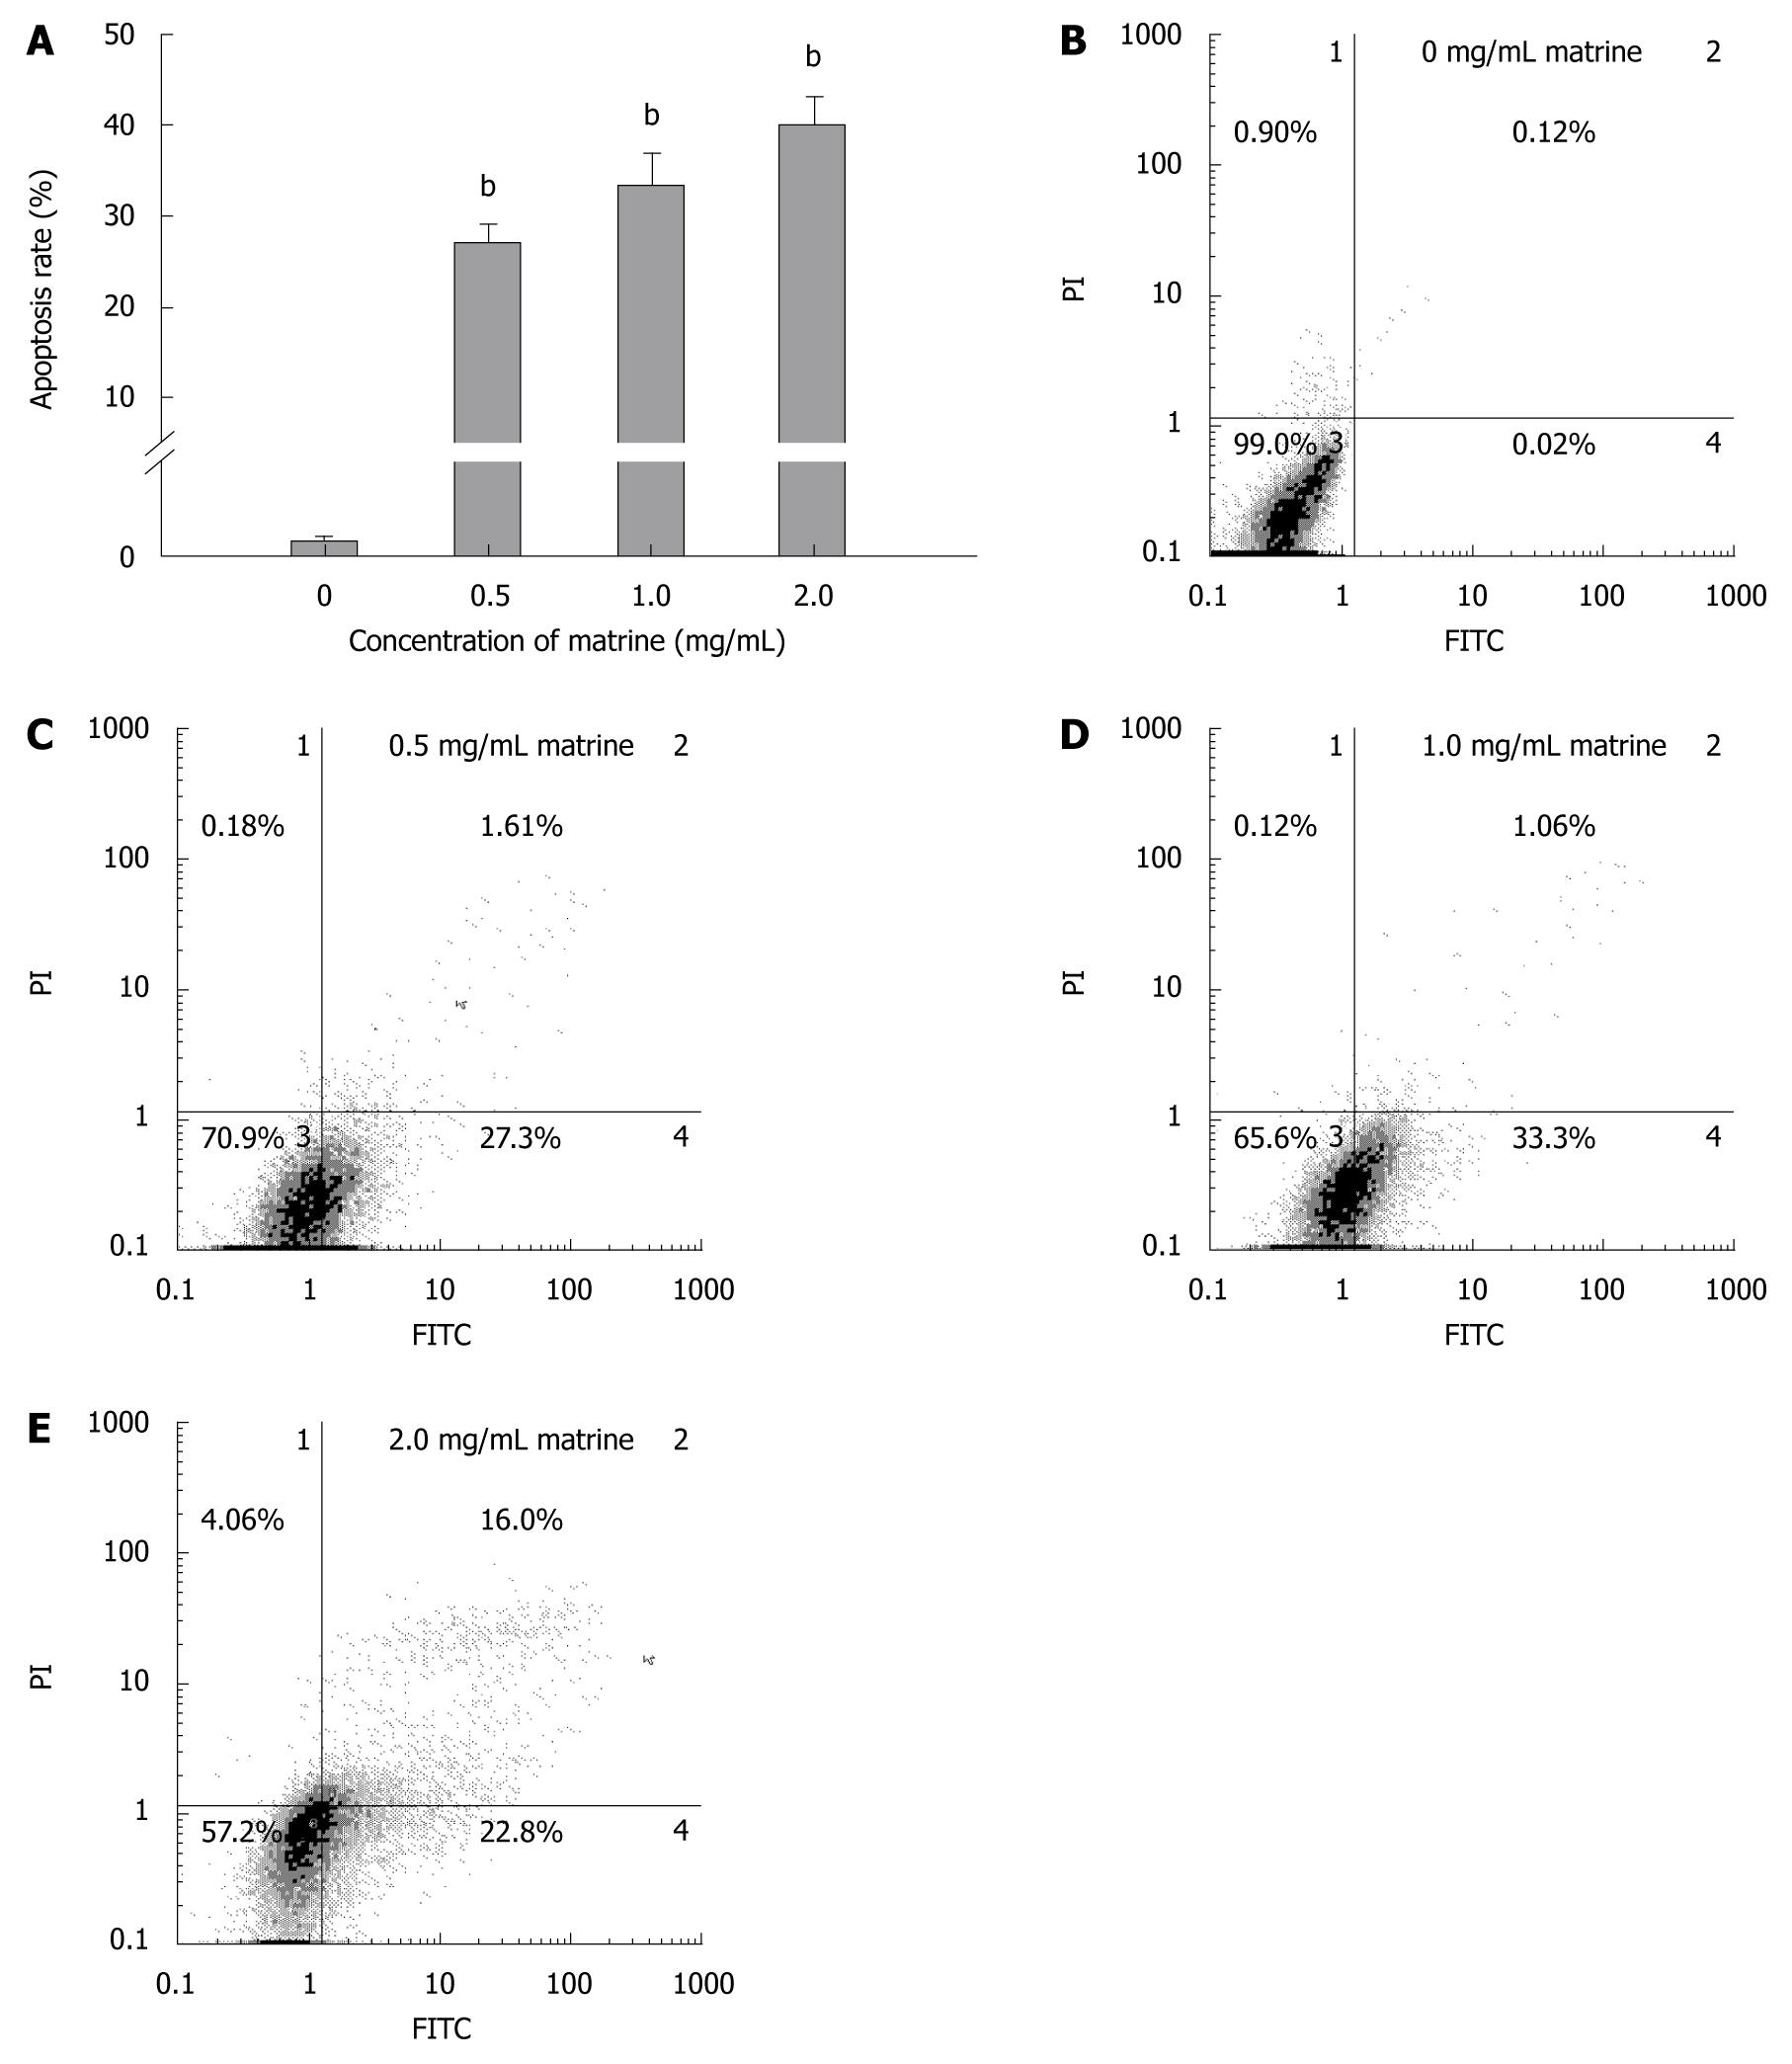
Figure 4 Matrine induces apoptosis of HepG2 cells.
A: Apoptosis rate of HepG2 cells treated with matrine at the concentration of 0.5, 1.0 and 2.0 mg/mL, respectively, were significantly different from that in control group. Furthermore, the percentage of apoptotic cells increased when the concentration of matrine was increased. The data are expressed as mean ± SD (n = 3); B-E: Histograms of HepG2 cells incubated with matrine at the concentration of 0, 0.5, 1.0 and 2.0 mg/mL, respectively. Early apoptotic HepG2 cells were observed after incubated with matrine at the concentration of 0.5 and 1.0 mg/mL, the late apoptotic HepG2 cells were observed after incubated with matrine at the concentration of 2.0 mg/mL. bP < 0.001 vs control group.
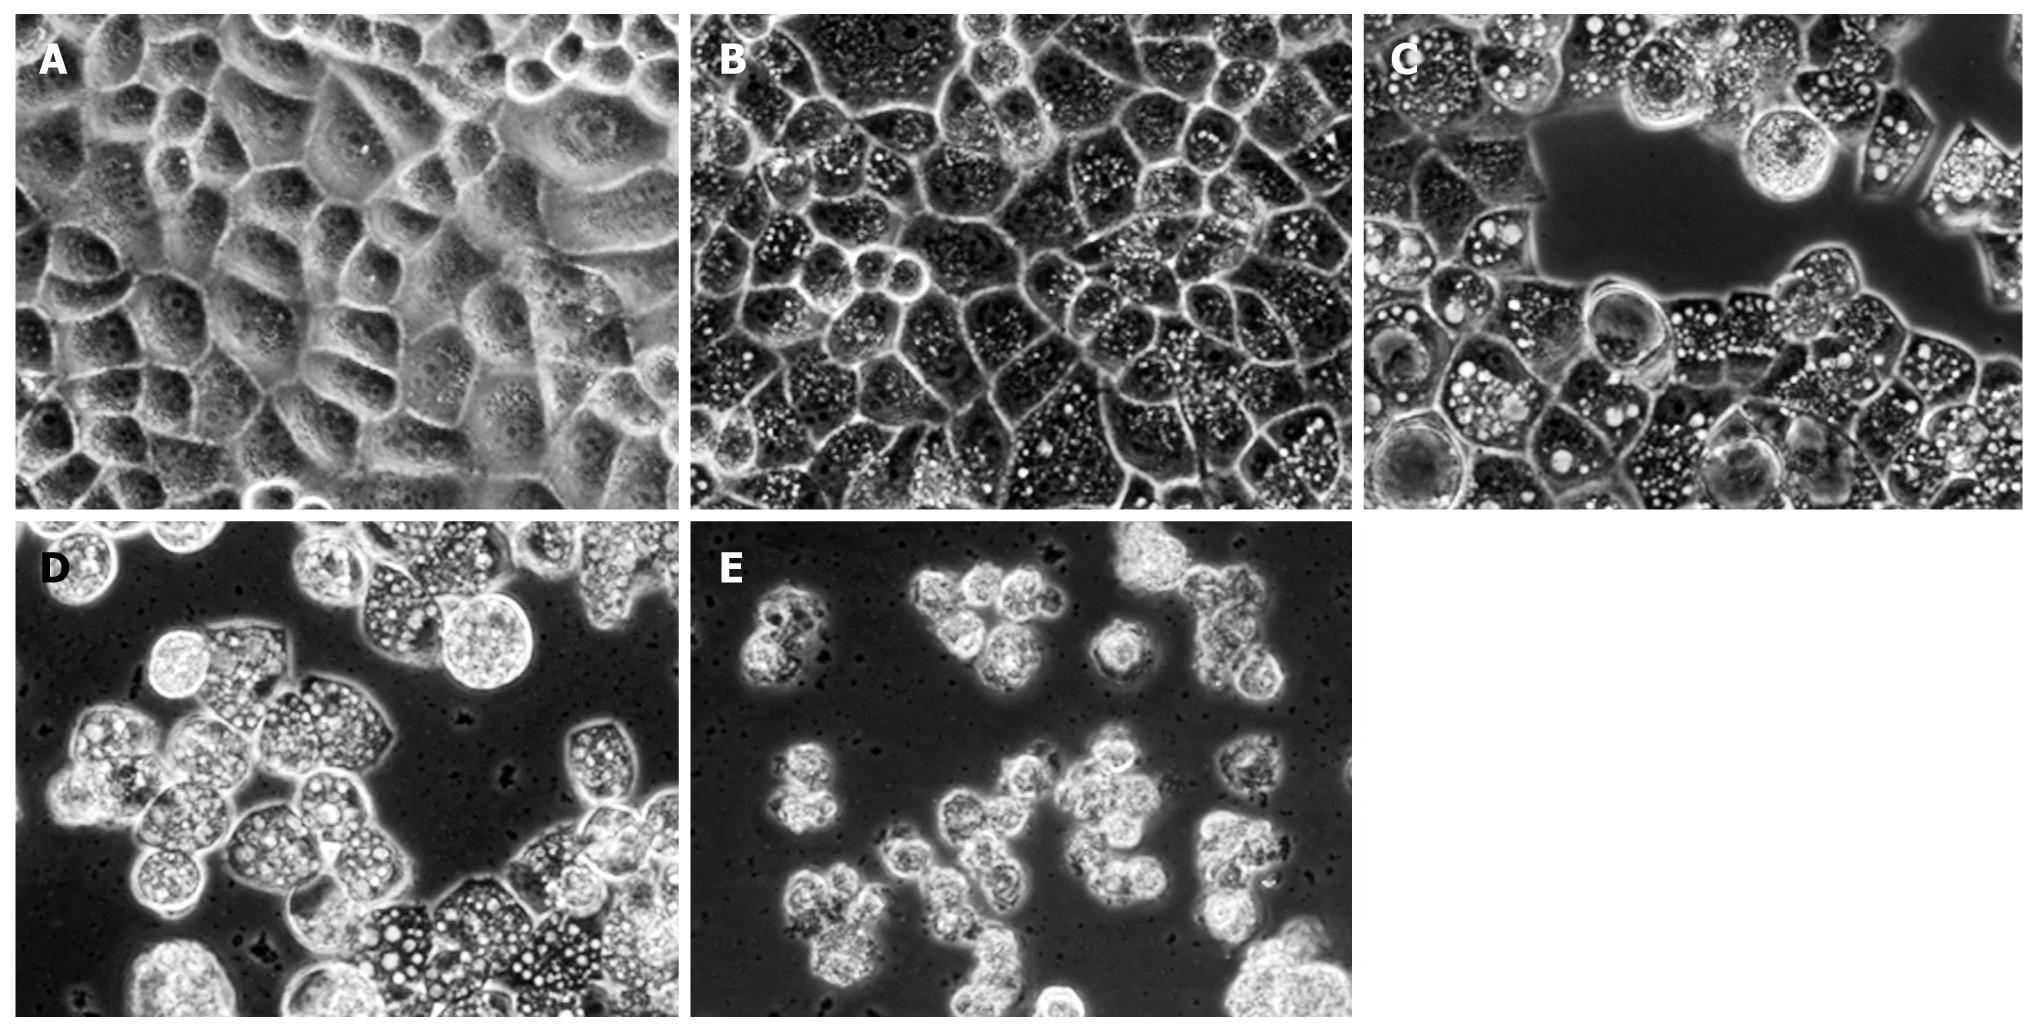
Figure 5 Inverted phase contrast microscopy showing matrine-induced morphologic changes of HepG2 cells.
The control cells were well adhered, displaying the normal morphology of HepG2 cells. In contrast, abundant cytoplasmic vacuoles were observed in cells treated with matrine. Moreover, vacuolization in cytoplasm progressively became larger and denser when the concentration of matrine was increased. The majority of HepG2 cells treated with matrine at the concentration of 2.0 mg/mL became round and shrunken and could not be affixed to the wall and suspended in culture medium (× 400 magnification). A: 0 mg/mL matrine; B: 0.25 mg/mL matrine; C: 0.5 mg/mL matrine; D: 1.0 mg/mL matrine; E: 2.0 mg/mL matrine.
Figure 6 Transmission electron microscopy showing normal morphology of cytoplasm, cell organelles, and nuclei of HepG2 cells not treated with matrine (A), characteristic ultrastructural morphology of autophagy (B), double-membrane (C) and a large number of autophagic vacuoles (D) of HepG2 cells treated with matrine, and sharply decreased autophagic vacuoles (E) of HepG2 cells treated with combination of 3-MA and matrine (A, B, E, × 4000; C, D, × 8000).
Arrowheads represent double-membrane, thick arrows represent autophagosomes, and thin arrows represent autolysosomes. Nu: Nucleus.
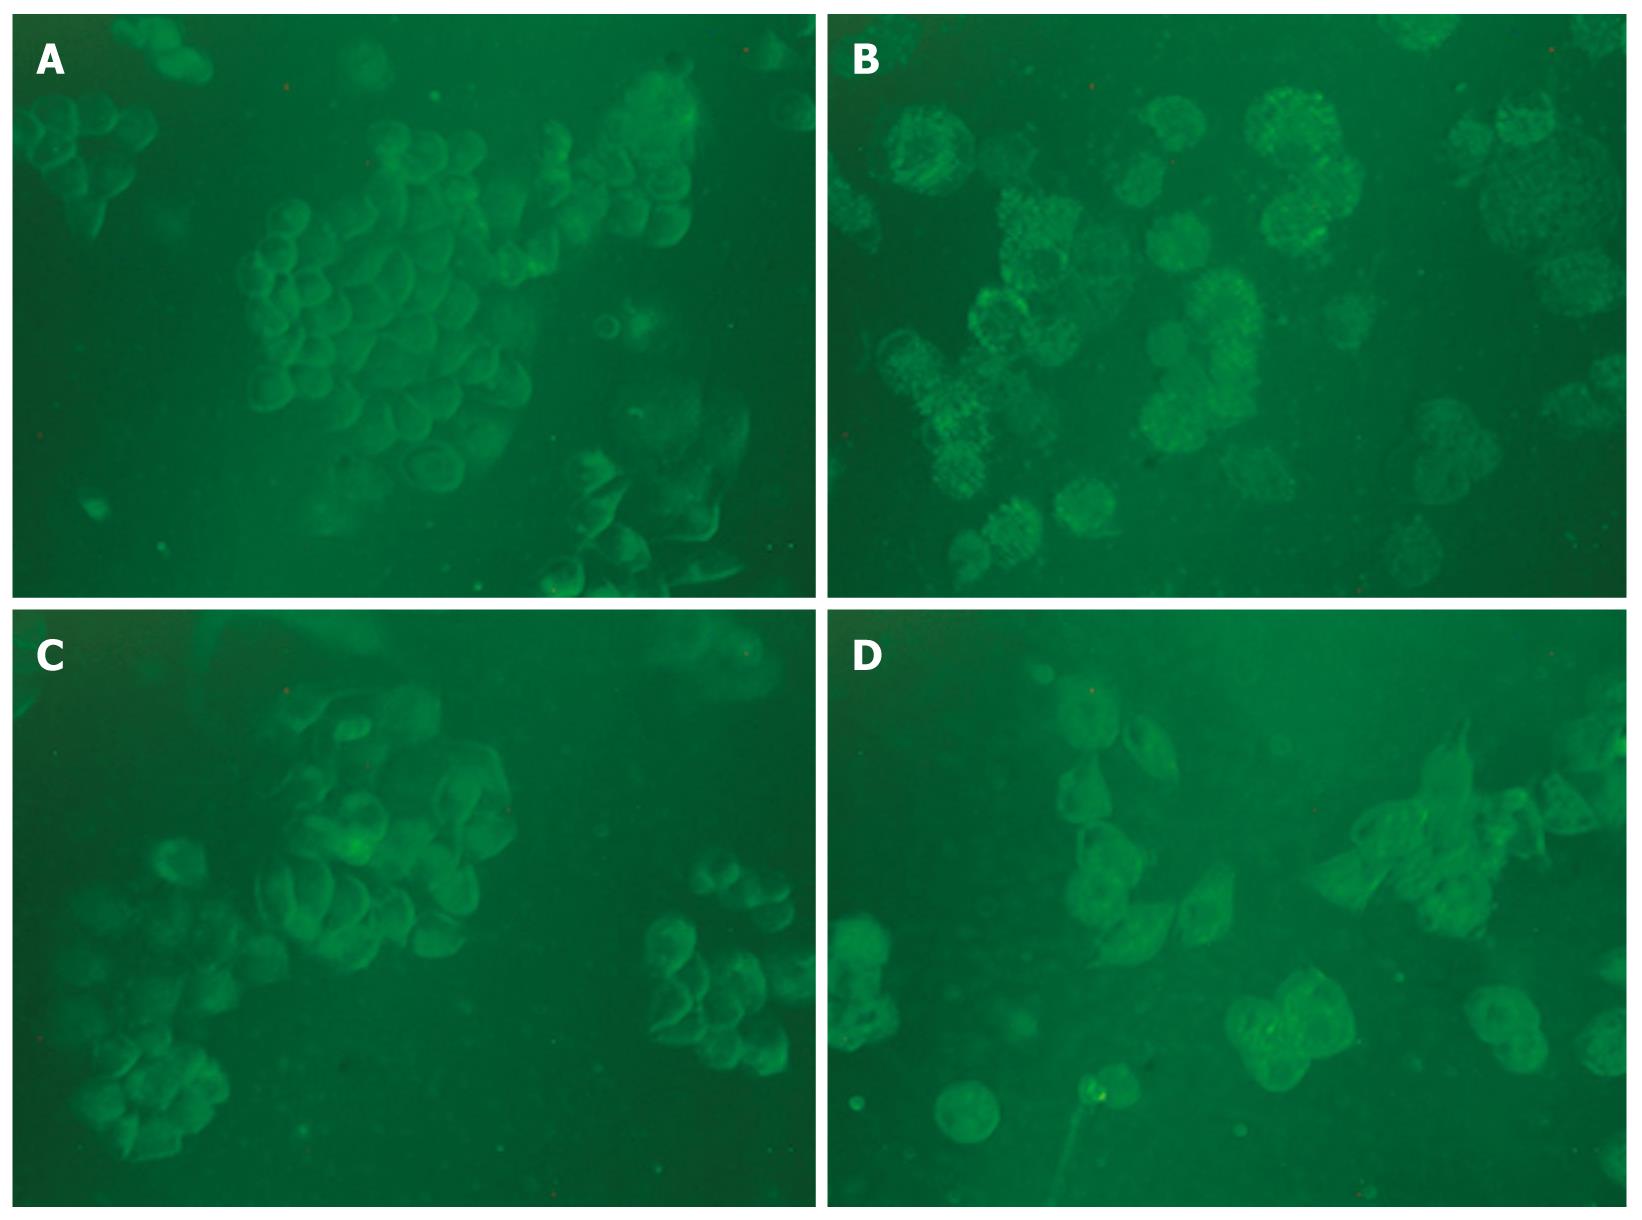
Figure 7 Monodansylcadaverine-labeled vacuoles in HepG2 cells.
Autophagic vacuoles were labeled with 0.05 mmol/L monodansylcadaverine (MDC) in phosphate-buffered saline (PBS) at 37°C for 10 min. The fluorescent density and the MDC-labeled particles in HepG2 cells were higher in matrine treatment group than in control group. The number of MDC-labeled particles in HepG2 cells was significantly lower in combined 3-MA and matrine treatment group than in single matrine treatment group (× 400 magnifications). A: Control; B: Matrine; C: 3-MA; D: 3-MA + matrine.
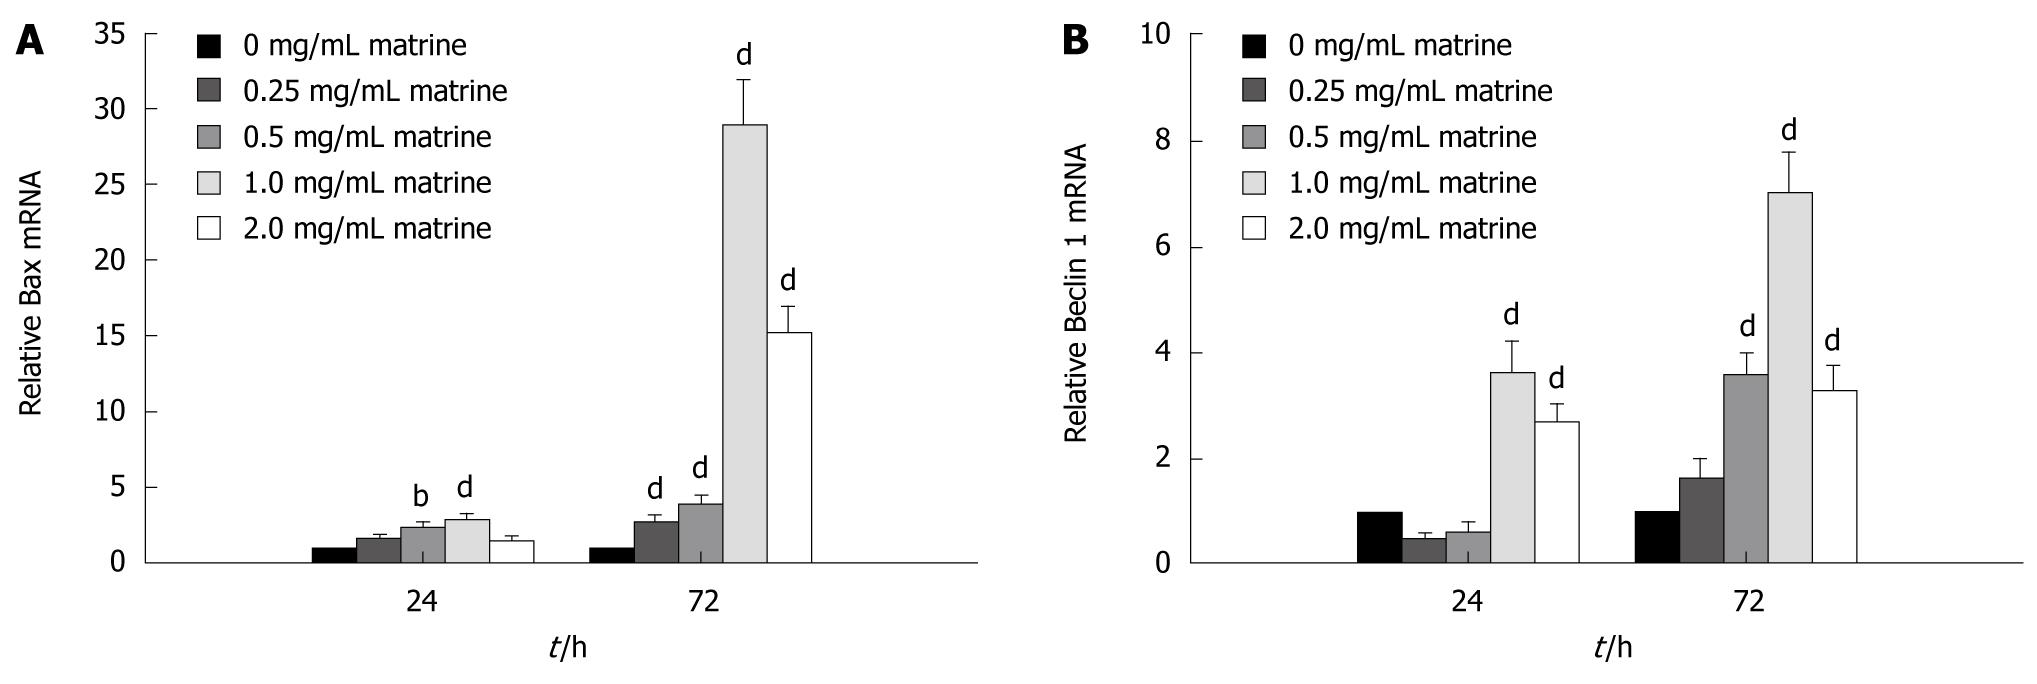
Figure 8 Matrine up-regulates the mRNA expression level of Bax (A) and Beclin 1 (B) in HepG2 cells.
Data are shown as mean ± SD of three independent experiments. bP < 0.01, dP < 0.001 vs control group.
- Citation: Zhang JQ, Li YM, Liu T, He WT, Chen YT, Chen XH, Li X, Zhou WC, Yi JF, Ren ZJ. Antitumor effect of matrine in human hepatoma G2 cells by inducing apoptosis and autophagy. World J Gastroenterol 2010; 16(34): 4281-4290
- URL: https://www.wjgnet.com/1007-9327/full/v16/i34/4281.htm
- DOI: https://dx.doi.org/10.3748/wjg.v16.i34.4281


