Copyright
©2010 Baishideng.
World J Gastroenterol. Aug 14, 2010; 16(30): 3816-3826
Published online Aug 14, 2010. doi: 10.3748/wjg.v16.i30.3816
Published online Aug 14, 2010. doi: 10.3748/wjg.v16.i30.3816
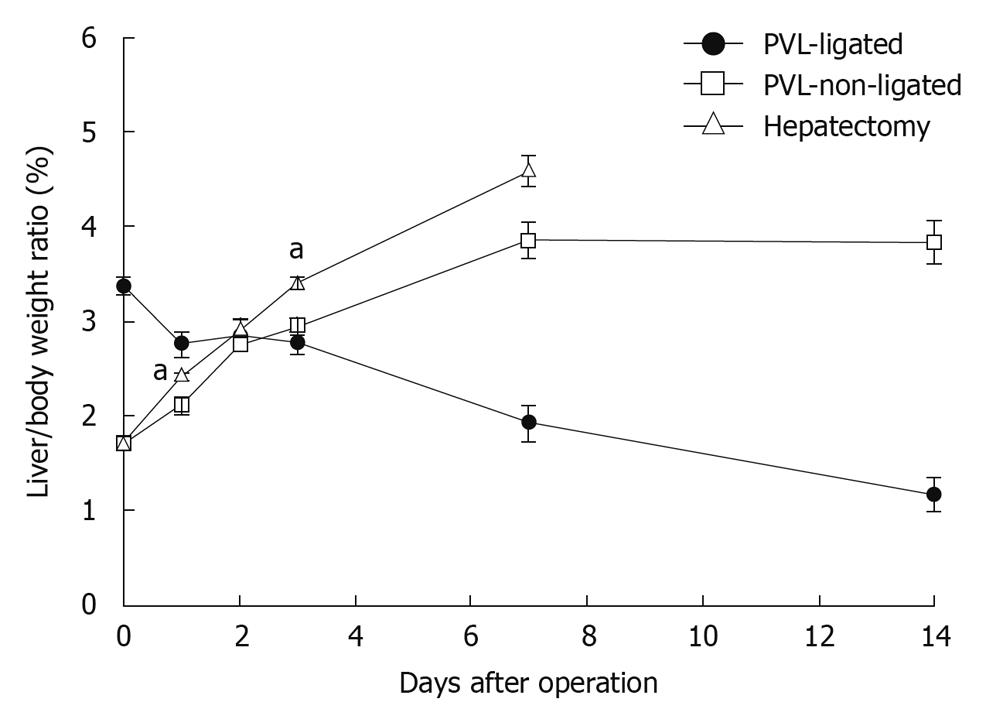
Figure 1 Changes in liver lobe to body weight ratio after portal vein ligation or partial hepatectomy.
To evaluate liver regeneration after portal vein ligation (PVL) or partial hepatectomy, liver lobe to body weight ratio was determined. Data are mean ± SE with n = 4-6 per group. aP < 0.05 vs PVL-non-ligated.
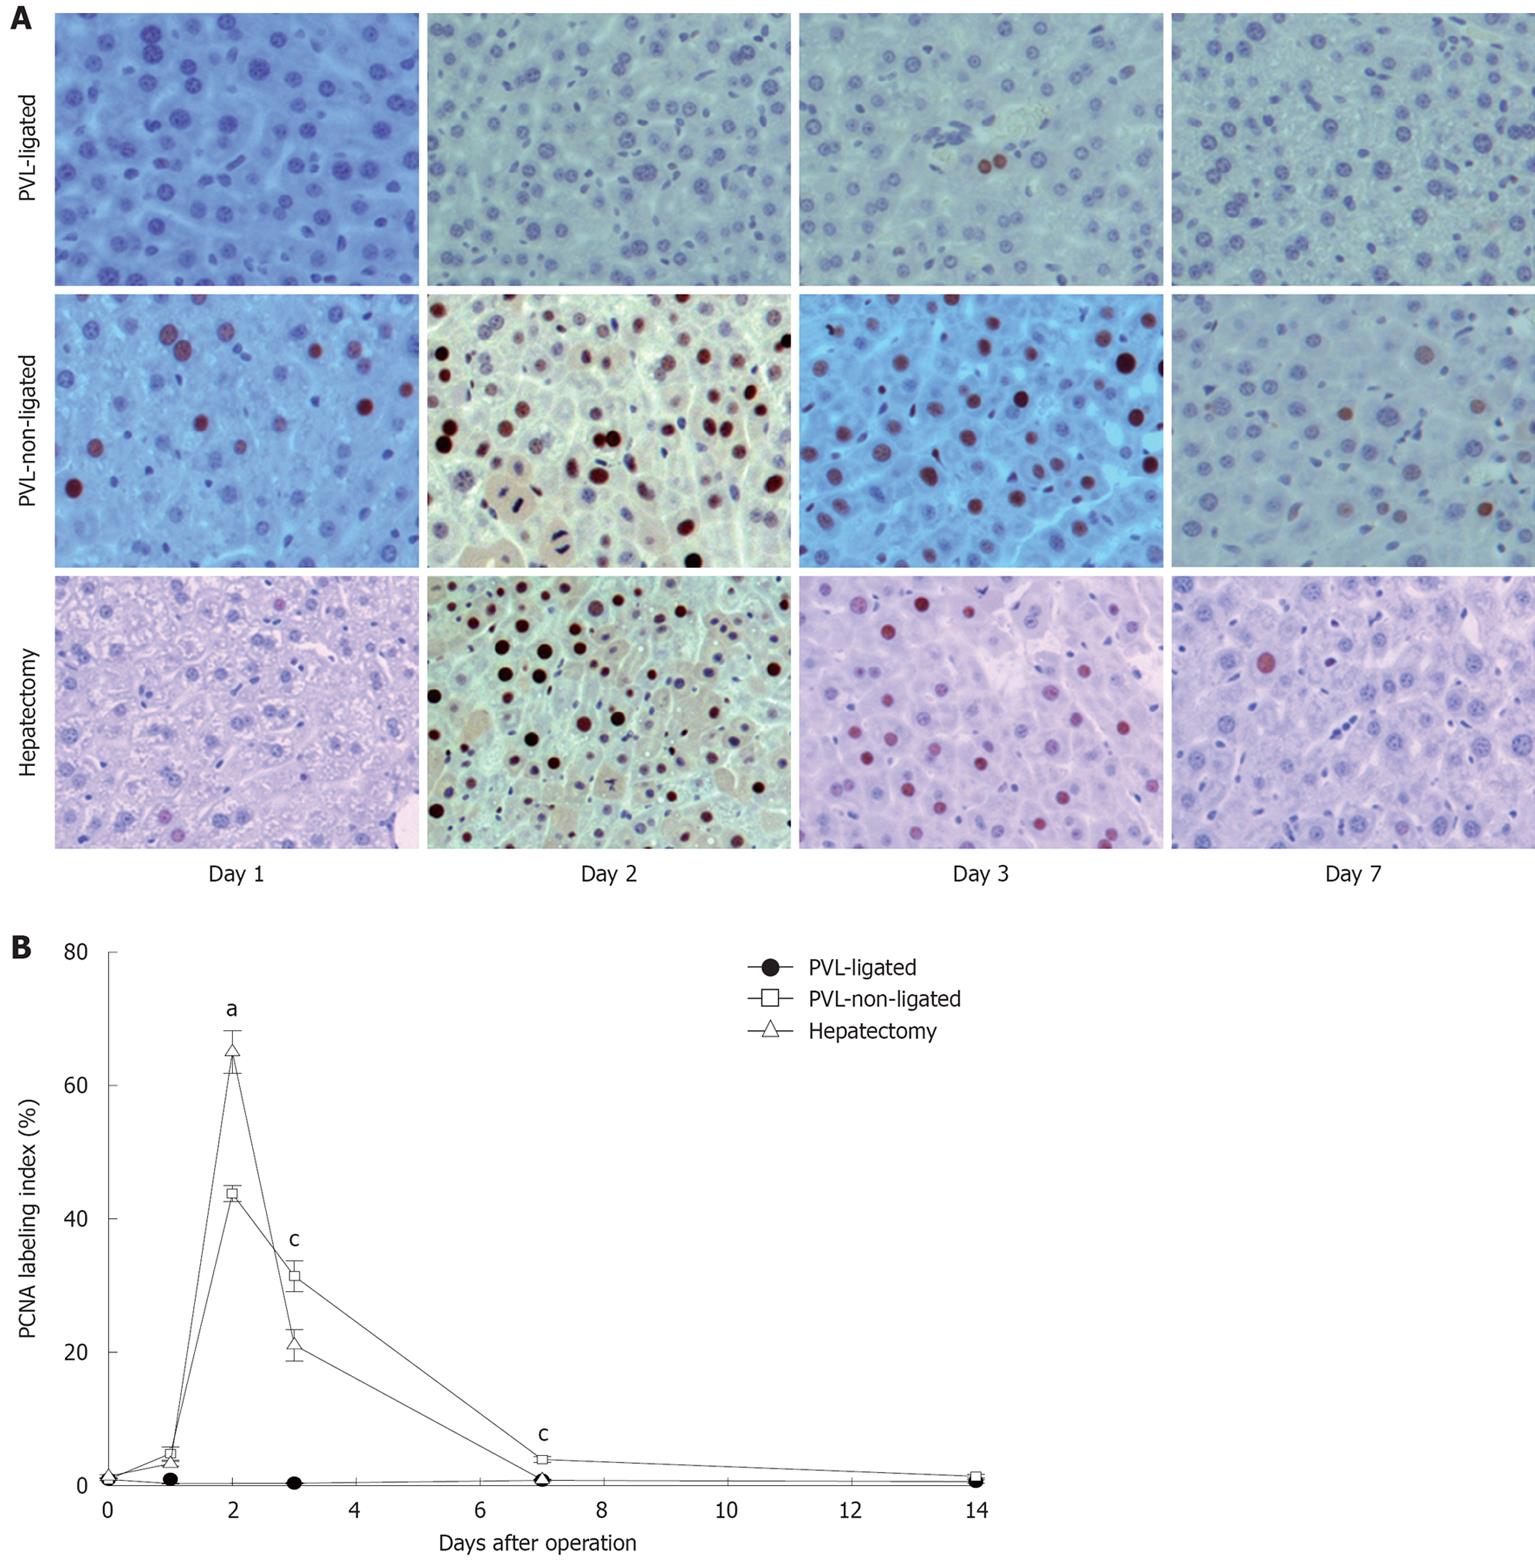
Figure 2 Hepatocyte proliferation after portal vein ligation.
A: Hepatocyte proliferation was determined by immunohistochemical staining for proliferating cell nuclear antigen (PCNA). Original magnification was 200 ×; B: Quantitative analysis of PCNA labeling. PCNA labeling index was expressed as percentage of positive nuclei of 400-600 hepatocytes from the 4-6 highest positive fields at high power (400 ×). Data are mean ± SE with n = 4-6 per group. aP < 0.05 vs PVL-non-ligated; cP < 0.05 vs partial hepatectomy.
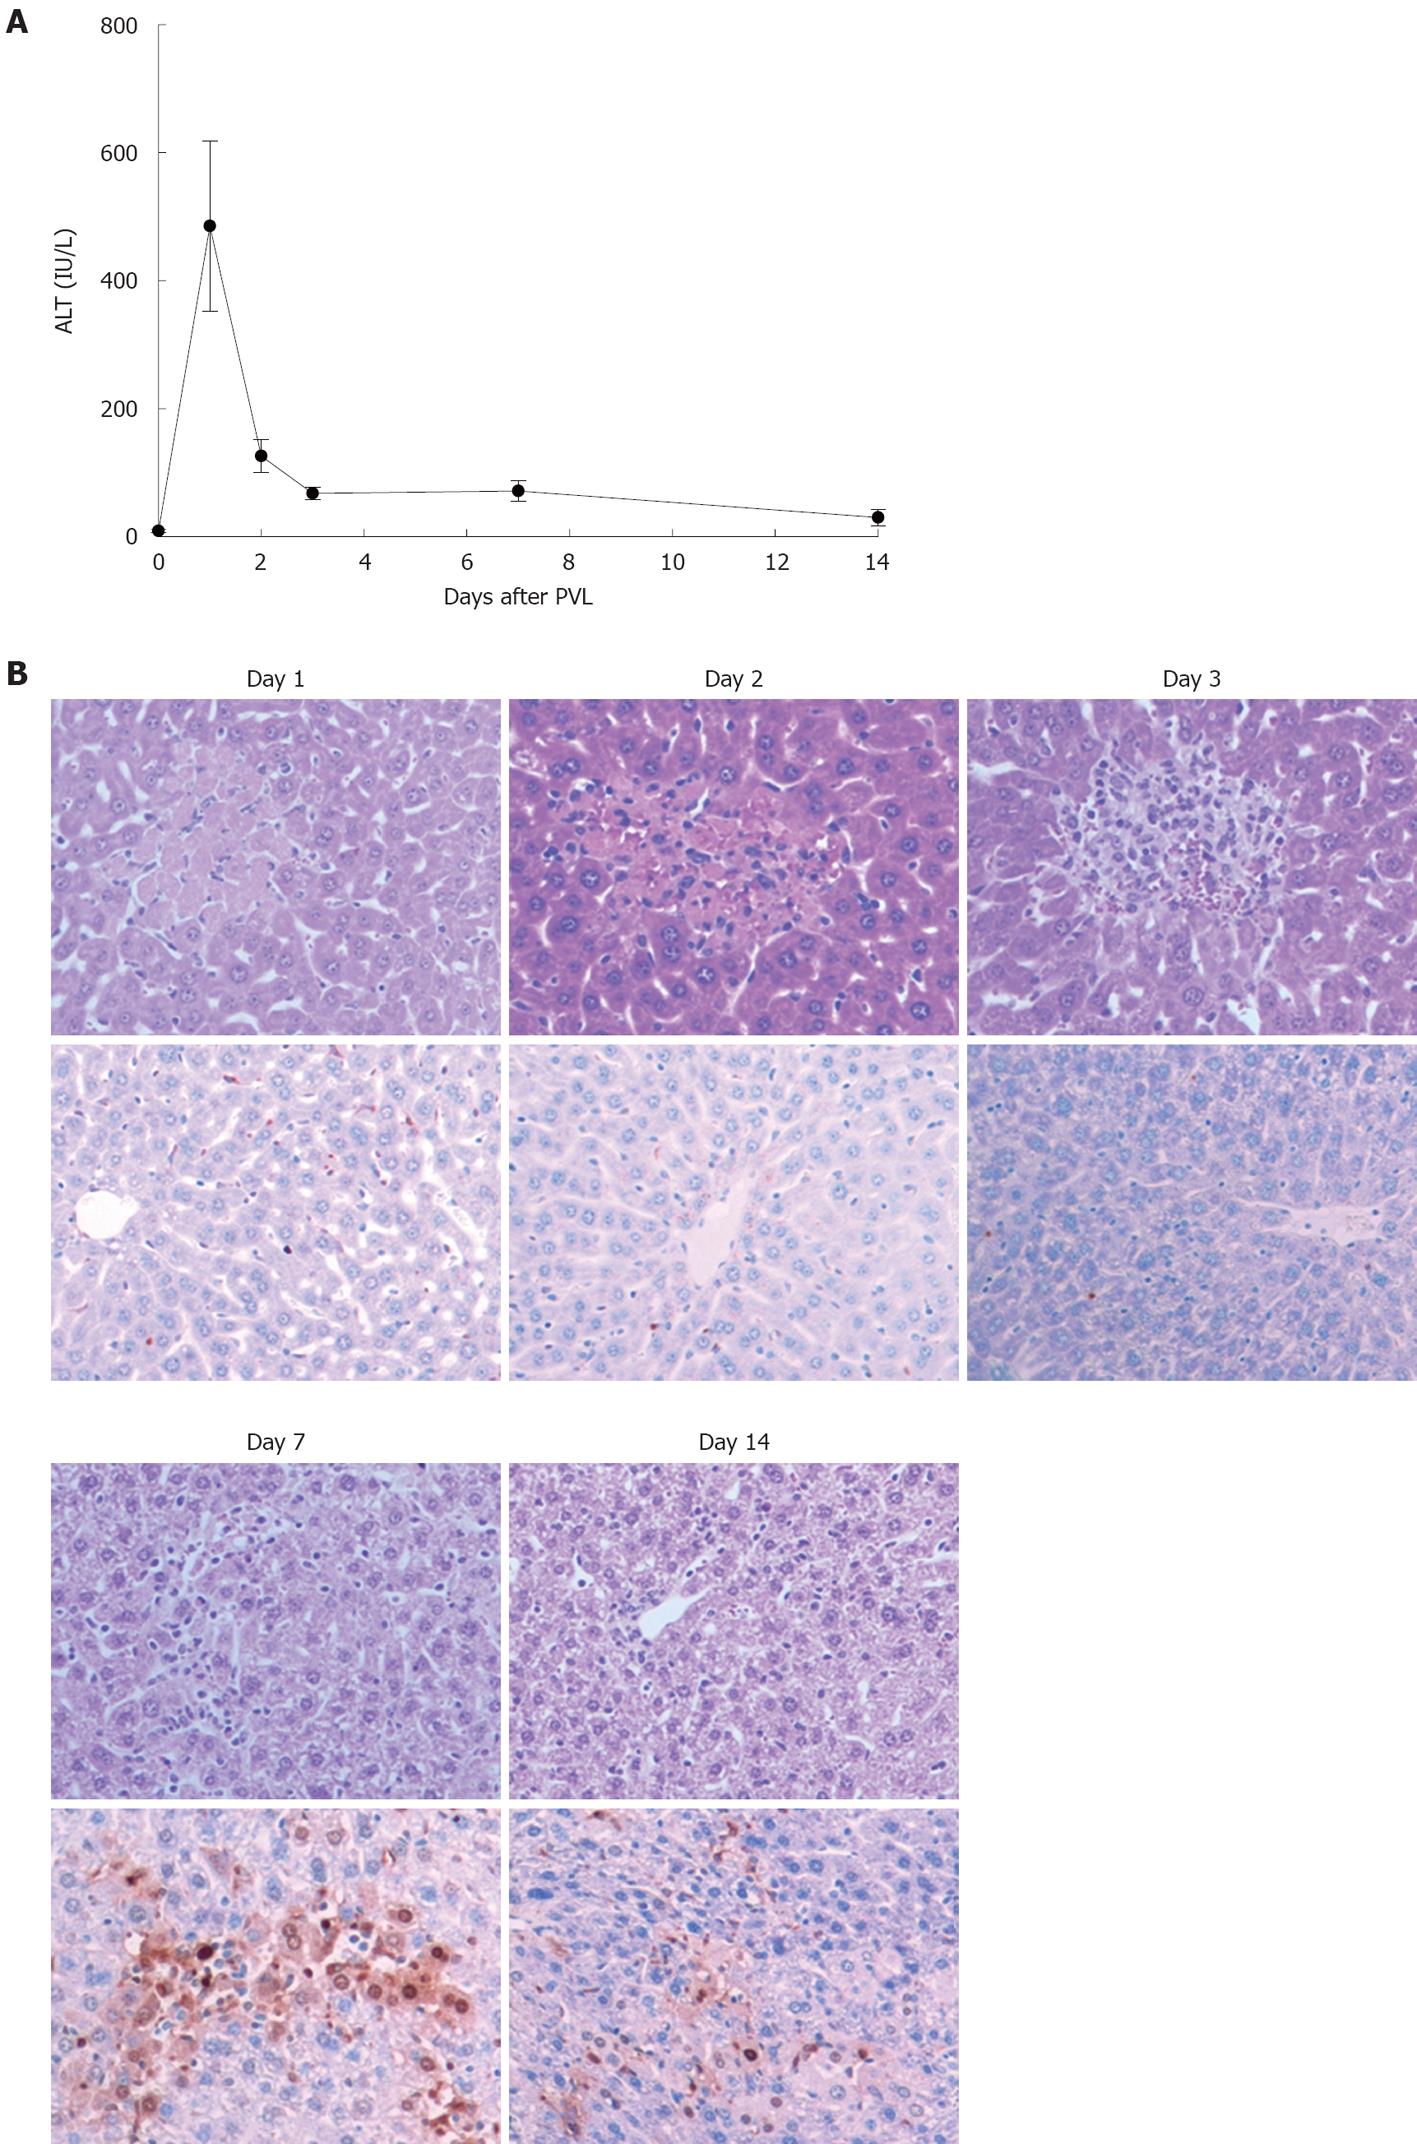
Figure 3 Effects of portal vein ligation on liver necrosis and apoptosis.
A: Liver injury was measured by serum levels of alanine aminotransferase (ALT). Data are mean ± SE with n = 4-6 per group; B: Representative pictures of HE staining (upper) and TUNEL staining (bottom). TUNEL staining was performed to determine the amount of hepatocyte apoptosis. Original magnification was 200 ×. PVL: Portal vein ligation.
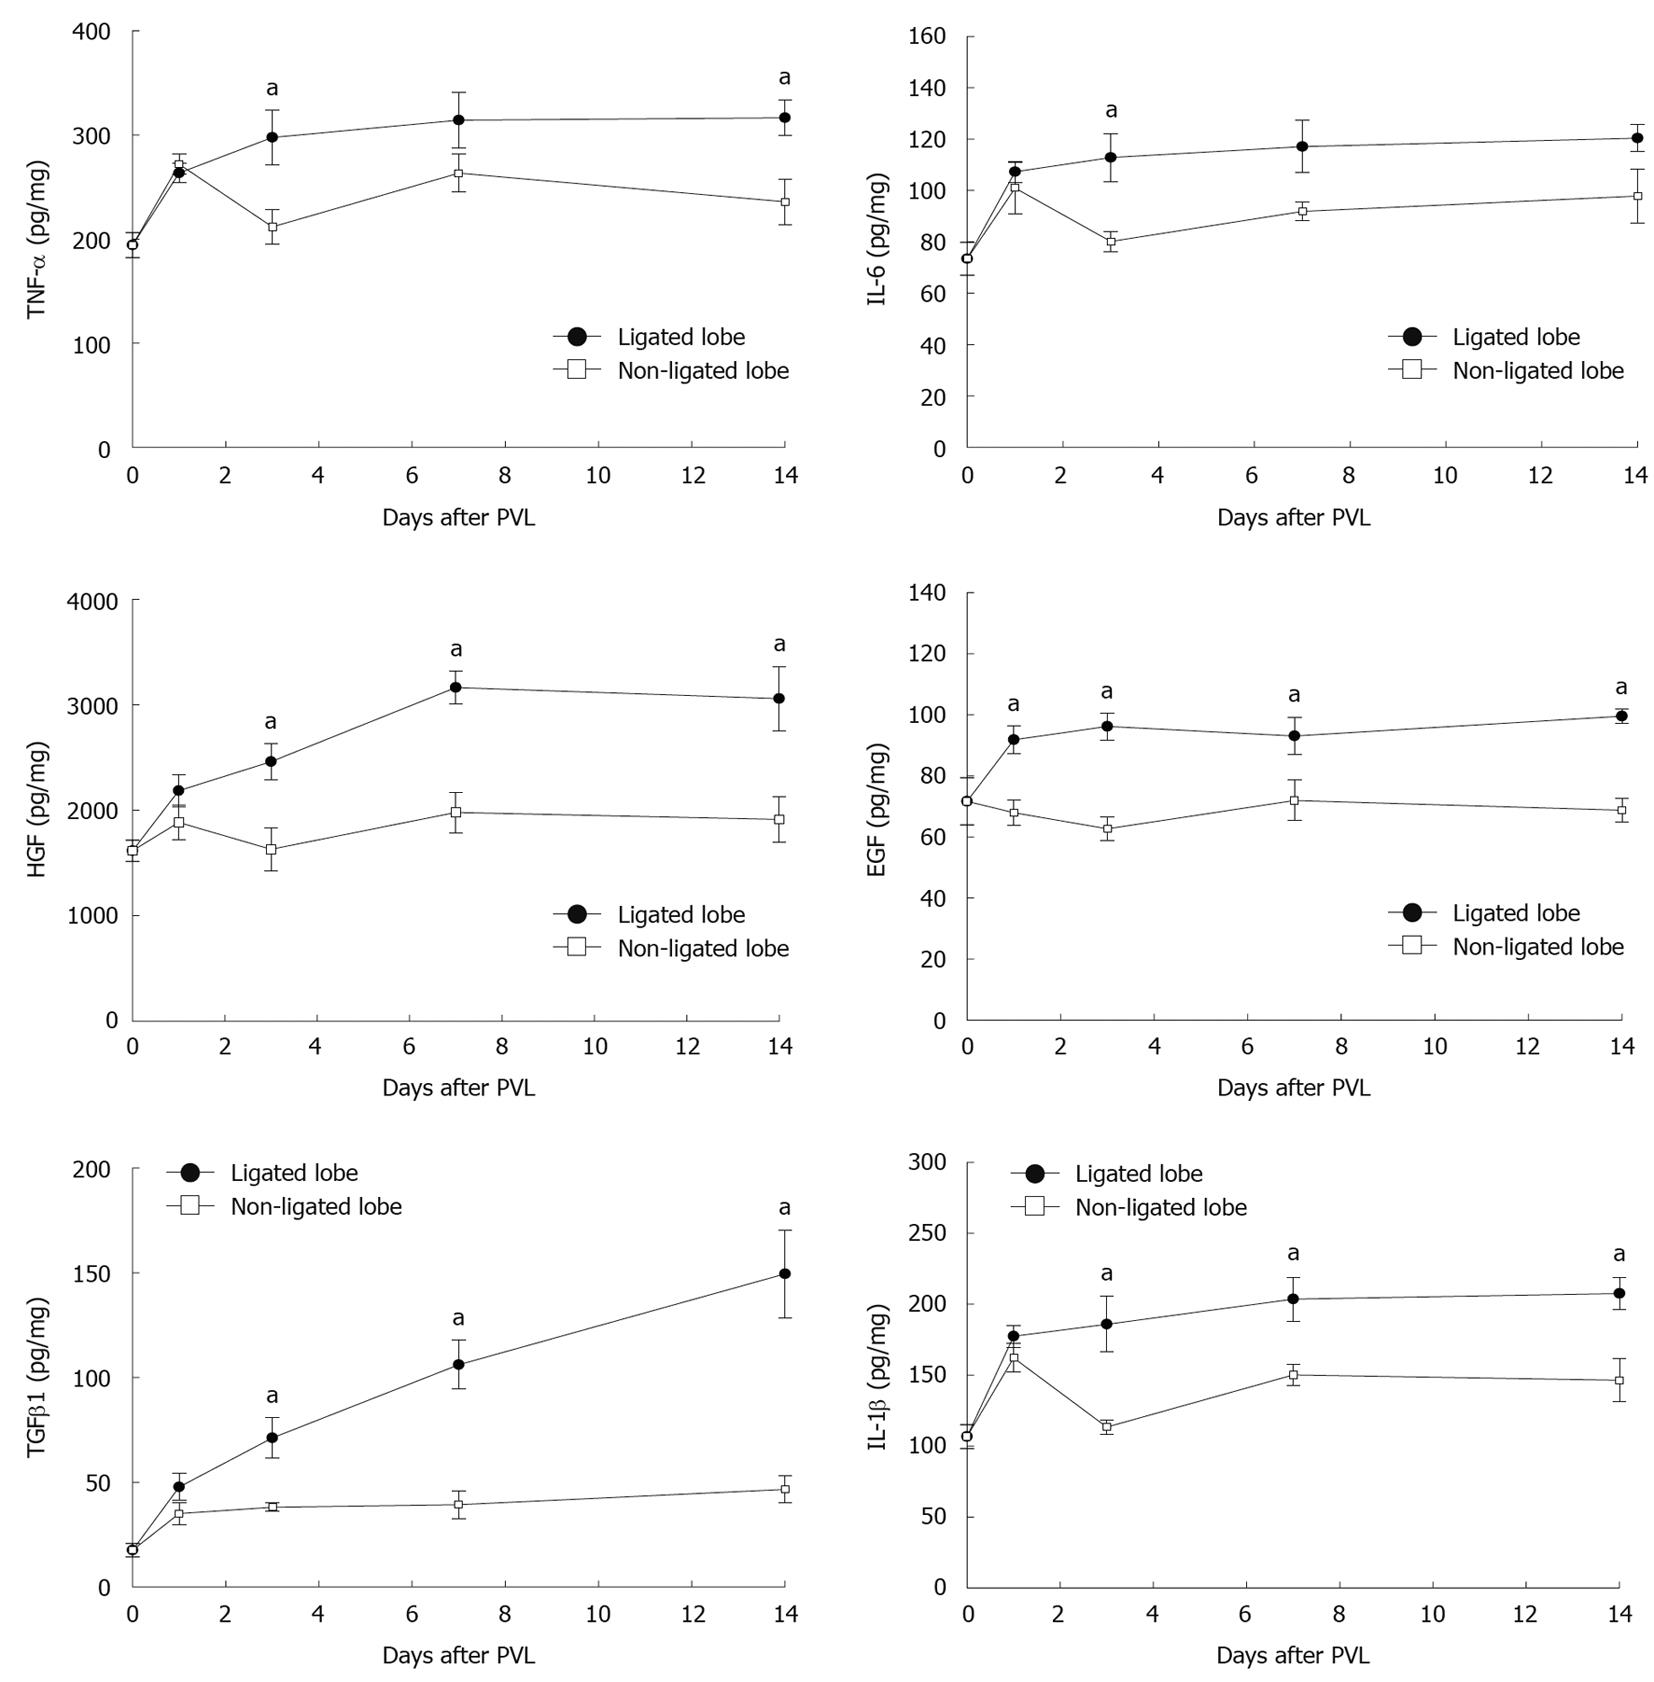
Figure 4 Effect of portal vein ligation on liver cytokines, growth factors, and chemokines.
To evaluate whether expression of relevant cytokines and growth factors are related to the growth of non-ligated lobes and/or the atrophy of ligated lobes, liver levels of tumor necrosis factor-α (TNF-α), interleukin (IL)-6, hepatocyte growth factor (HGF), epidermal growth factor (EGF), transforming growth factor β1 (TGFβ1), and IL-1β were analyzed by enzyme-linked immunosorbent assay (ELISA). Liver lysates were processed for ELISA. Data are mean ± SE with n = 4-15 per group. aP < 0.05 vs portal vein ligation (PVL)-non-ligated.
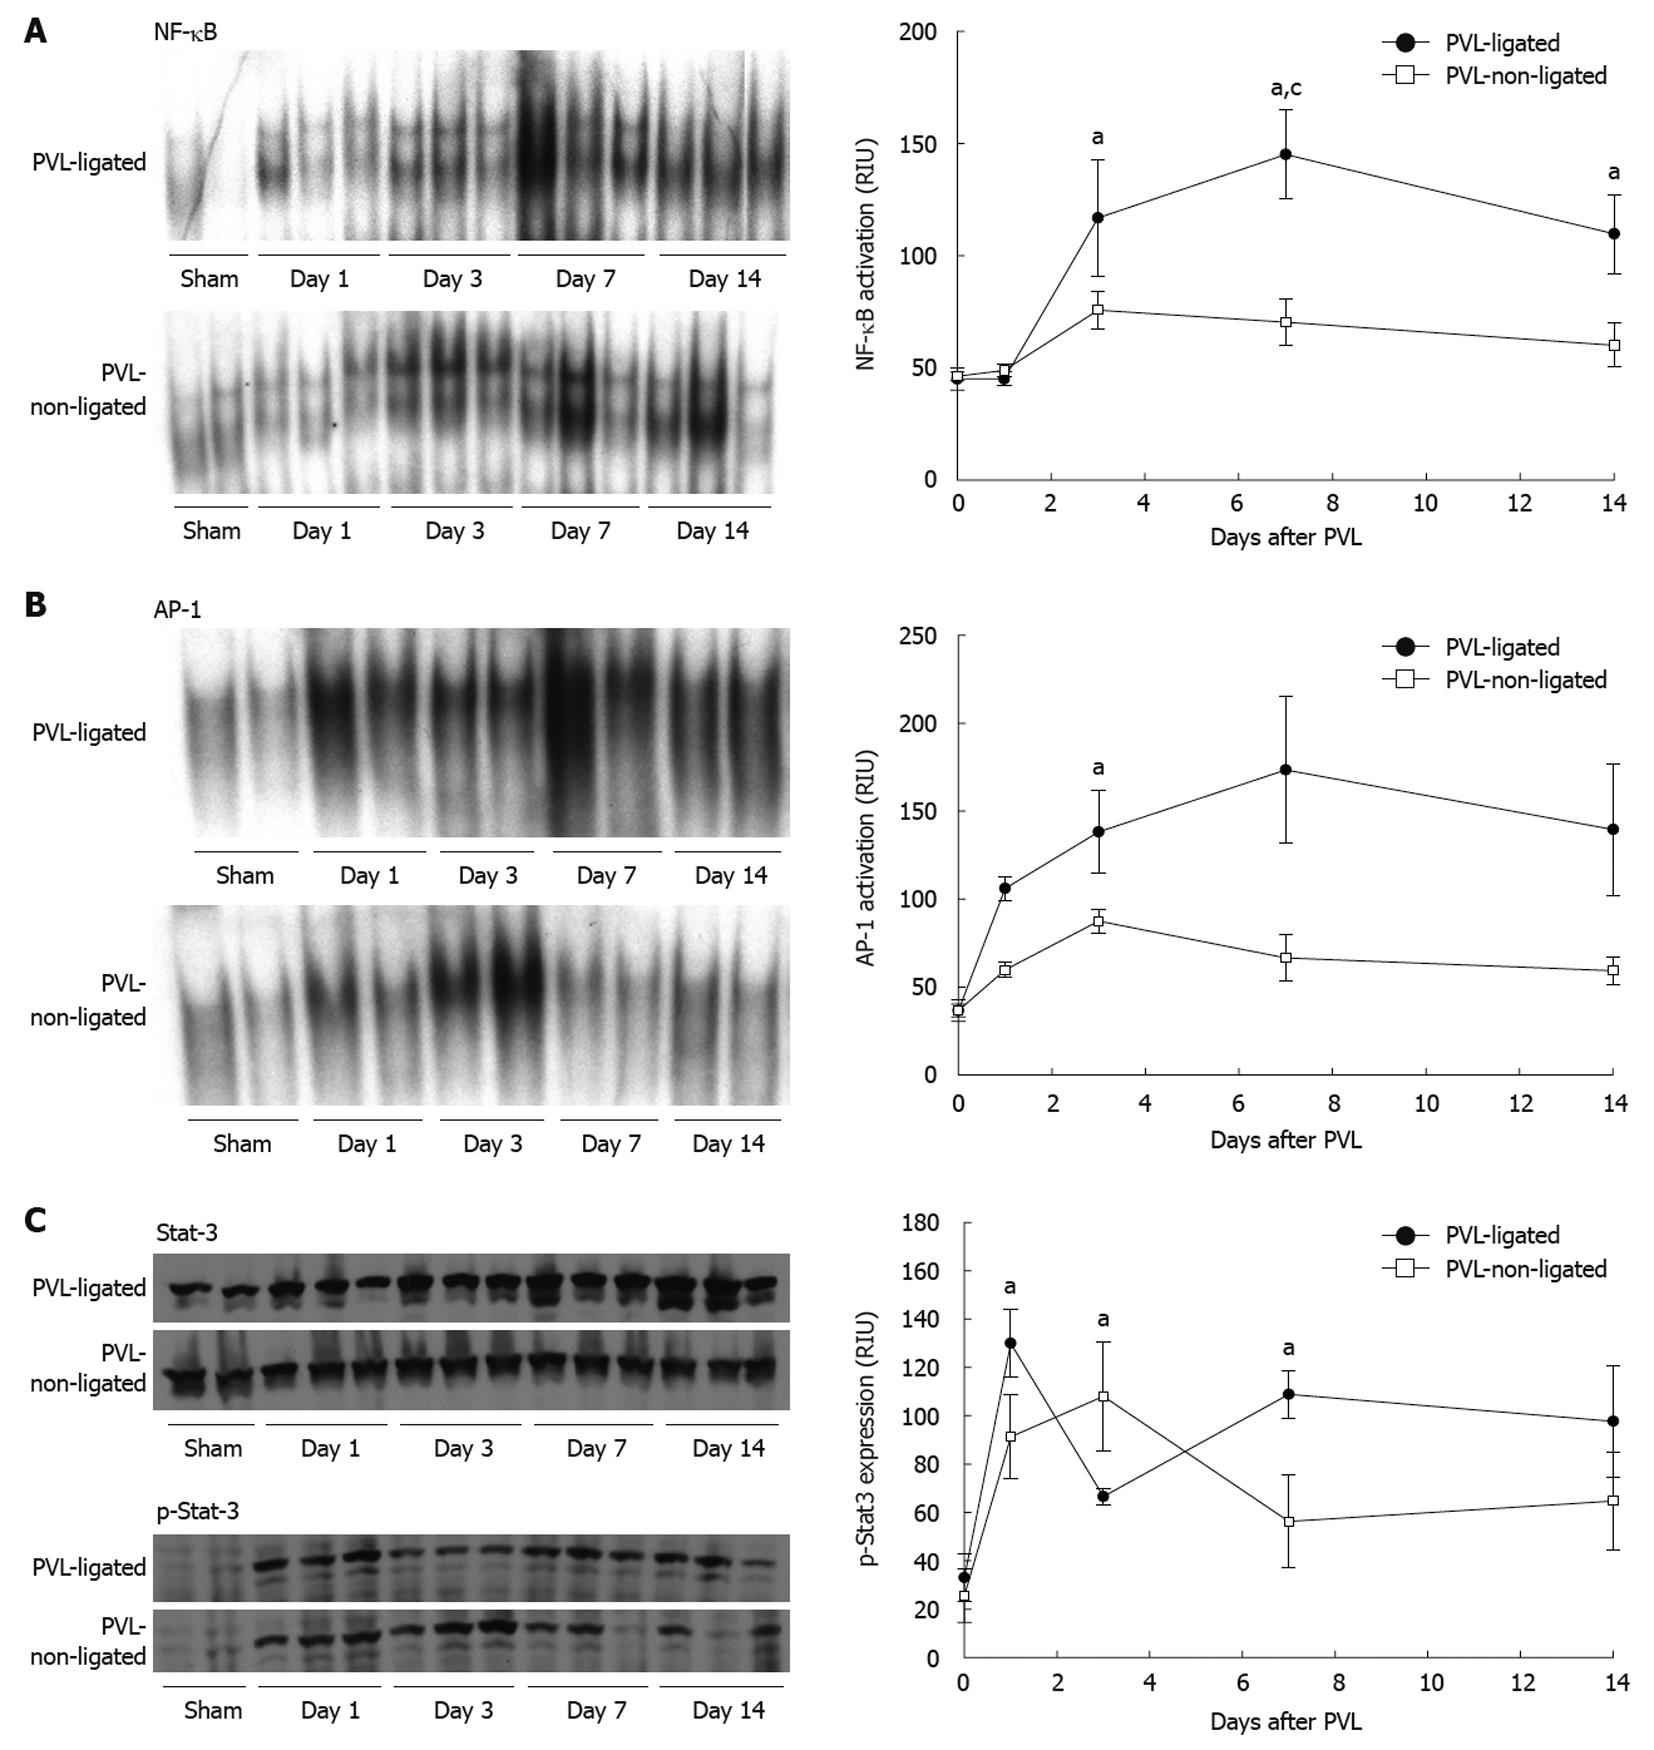
Figure 5 Transcription factor activation after portal vein ligation.
Nuclear factor (NF)-κB (A), activator protein (AP)-1 (B) and signal transducer and activator of transcription 3 (STAT3) (C) were examined in liver extracts. For NF-κB and AP-1, liver nuclear extracts were analyzed by electrophoretic mobility shift assay. For STAT3, liver lysates were assessed by Western blotting. Results were quantitated by image analysis of autoradiograms and chemiluminescence films. Data are mean ± SE with n = 4 per group. A: aP < 0.05 vs sham-operated group; cP < 0.05 vs portal vein ligation (PVL)-non-ligated group; B: aP < 0.05 vs PVL-non-ligated group; C: aP < 0.05 vs sham-operated group.
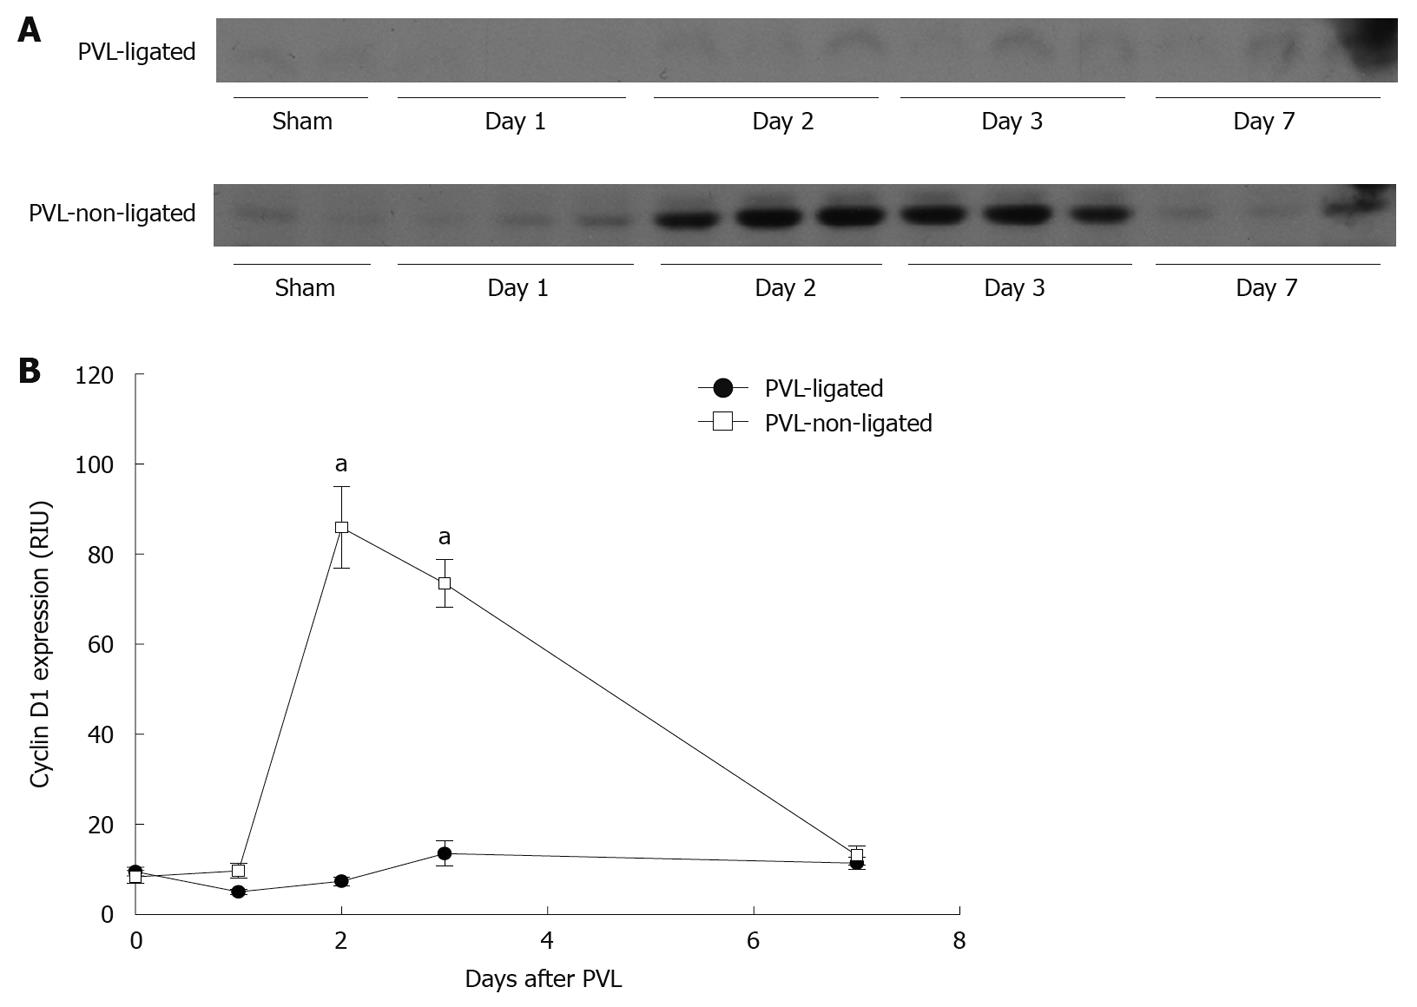
Figure 6 Liver cyclin D1 expression after portal vein ligation.
A: Liver lysates were assessed for cyclin D1 protein expression by Western blotting; B: Chemiluminescence films were quantitated by image analysis. Data are mean ± SE with n = 4 per group. aP < 0.05 vs portal vein ligation (PVL)-ligated group.
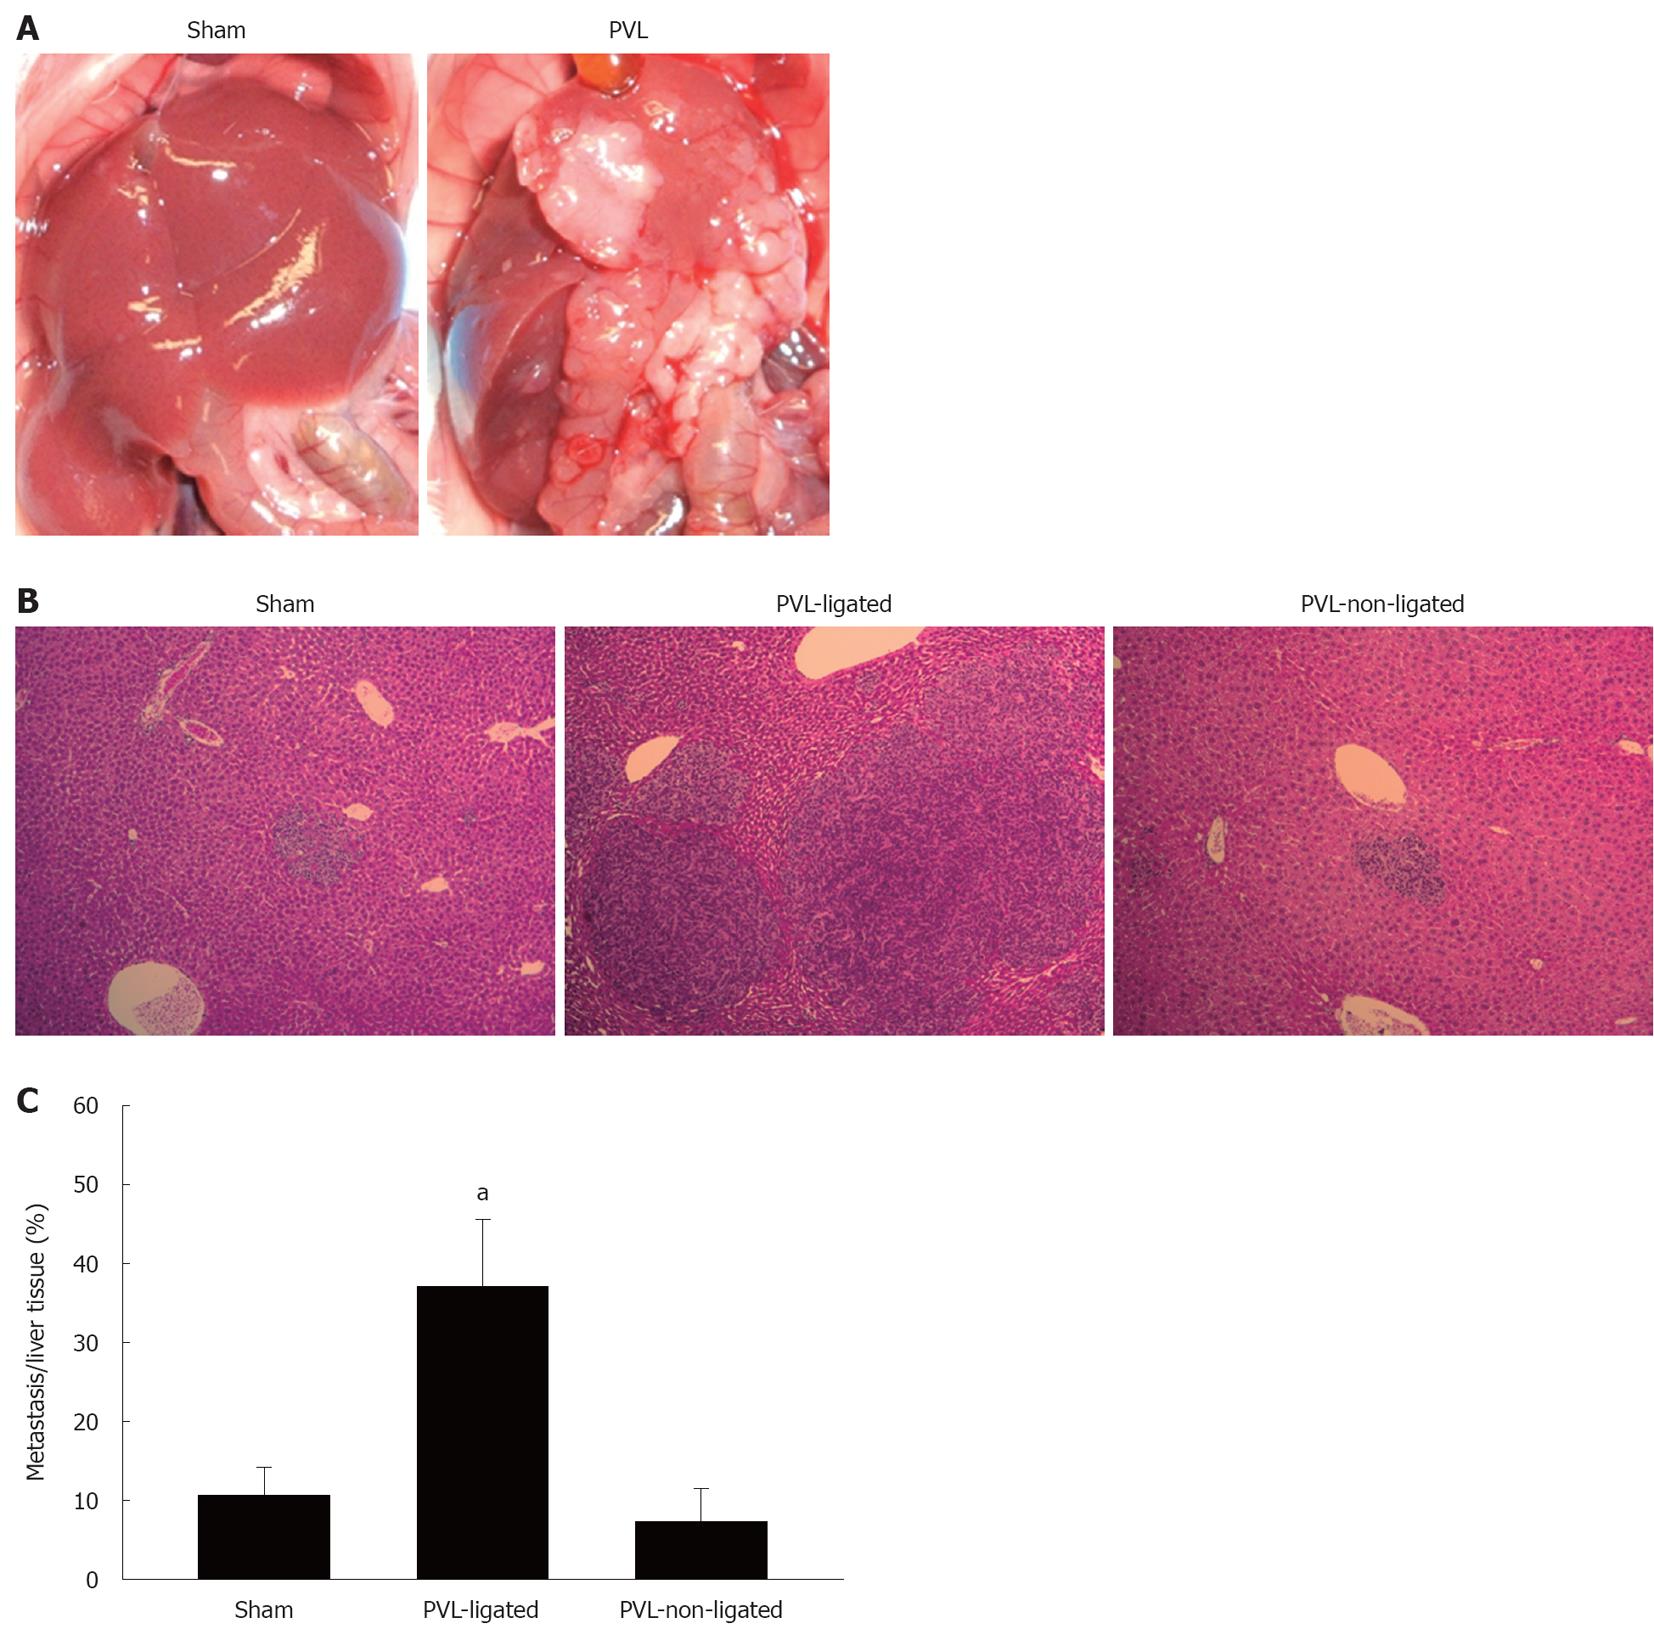
Figure 7 Effect of portal vein ligation on tumor growth.
A: CT26.WT cells were injected into portal the vein. Mice were sacrificed at 14 d after injection following sham operation or portal vein ligation (PVL) performed on day 7 after injection; B: Representative pictures of liver histology after PVL. Small metastatic foci were observed in sham-operated and non-ligated lobes. Large metastatic foci were observed in ligated lobes. Original magnification was 10 ×; C: The ratio of metastases to normal liver was measured by morphometry. Data are mean ± SE with n = 4 per group. aP < 0.05 vs sham-operated group and PVL-non-ligated group.
- Citation: Sakai N, Clarke CN, Schuster R, Blanchard J, Tevar AD, Edwards MJ, Lentsch AB. Portal vein ligation accelerates tumor growth in ligated, but not contralateral lobes. World J Gastroenterol 2010; 16(30): 3816-3826
- URL: https://www.wjgnet.com/1007-9327/full/v16/i30/3816.htm
- DOI: https://dx.doi.org/10.3748/wjg.v16.i30.3816


