Copyright
©2010 Baishideng.
World J Gastroenterol. Jan 21, 2010; 16(3): 320-329
Published online Jan 21, 2010. doi: 10.3748/wjg.v16.i3.320
Published online Jan 21, 2010. doi: 10.3748/wjg.v16.i3.320
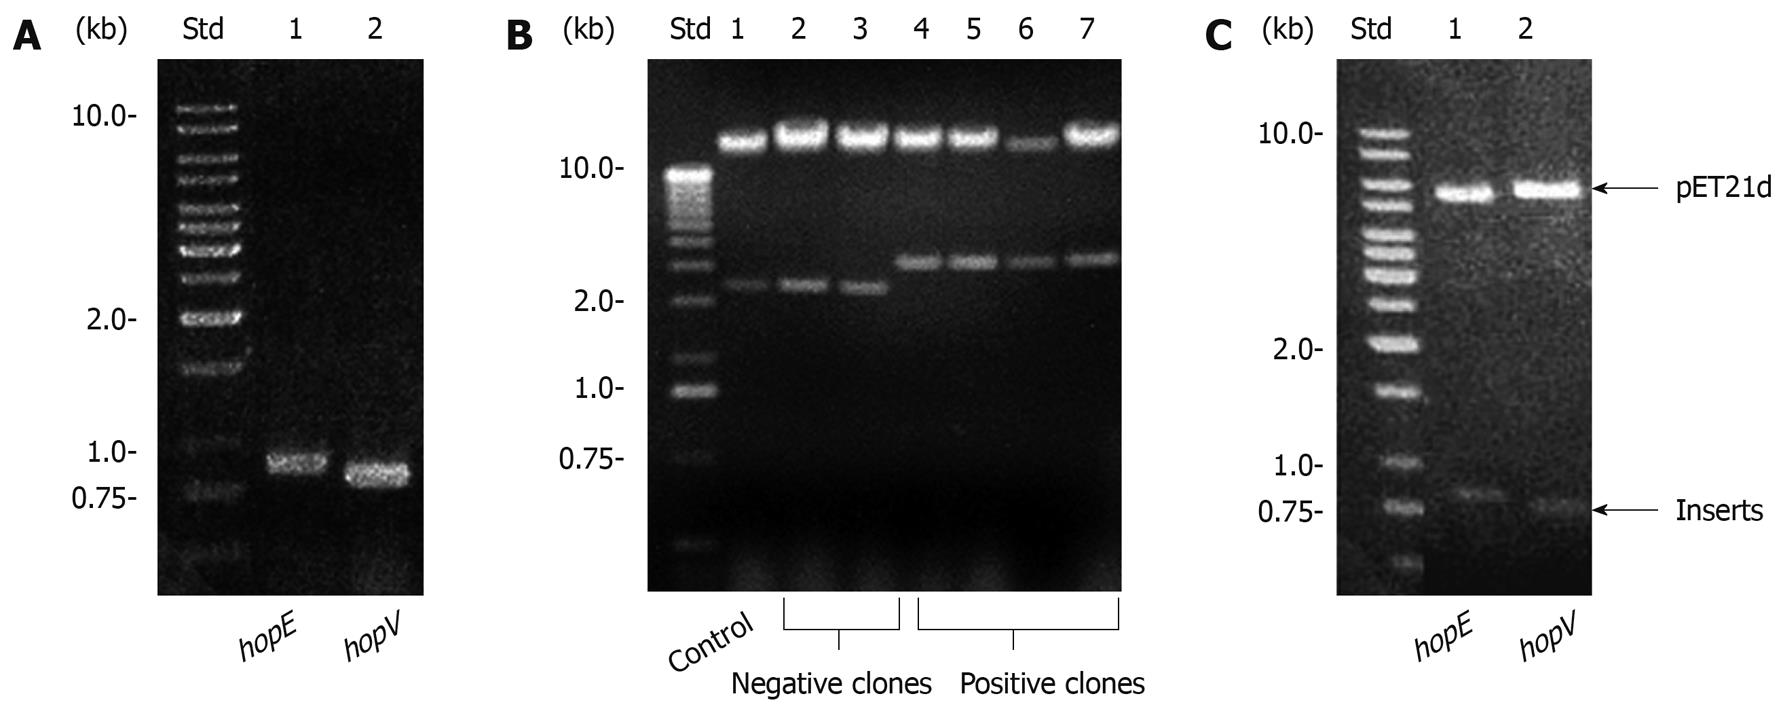
Figure 1 Cloning of H.
pylori hopE and hopV genes. A: Polymerase chain reaction (PCR) amplification of hopE and hopV genes. Amplicons and plasmids were separated by 1% agarose gel electrophoresis. Lane Std: 1 kb DNA ladder standard; B: Detection of plasmids carrying the hopE gene. Lane 1: Strain AD494(DE3)pLysS with pET21d as control. Lanes 2, 3: Negative clones, lanes 4-7 plasmids carrying the hopE gene; C: Release of inserts carrying the hopE and hopV genes after NcoI/HindIII and NdeI/BamHI digestions respectively. Lane Std: 1 kb DNA ladder standard (Fermentas).
Figure 2 Expression of H.
pylori hopE and hopV genes in Escherichia coli AD494(DE3)pLysS. Bacterial lysates were separated in 12%-15% PAGE-SDS gel, stained with Coomassie blue (A and B) or analyzed by Western blotting (C and D). Conditions for HopE expression are indicated below the figure (A, lanes 5 and 6; C, lane 2). Conditions for HopV expression are indicated under the figure (B, lanes 3 and 4; D, lane 2). Arrows indicate electrophoretic migration of these proteins. Lane Std: Prestained molecular weight marker in kDa (Fermentas).
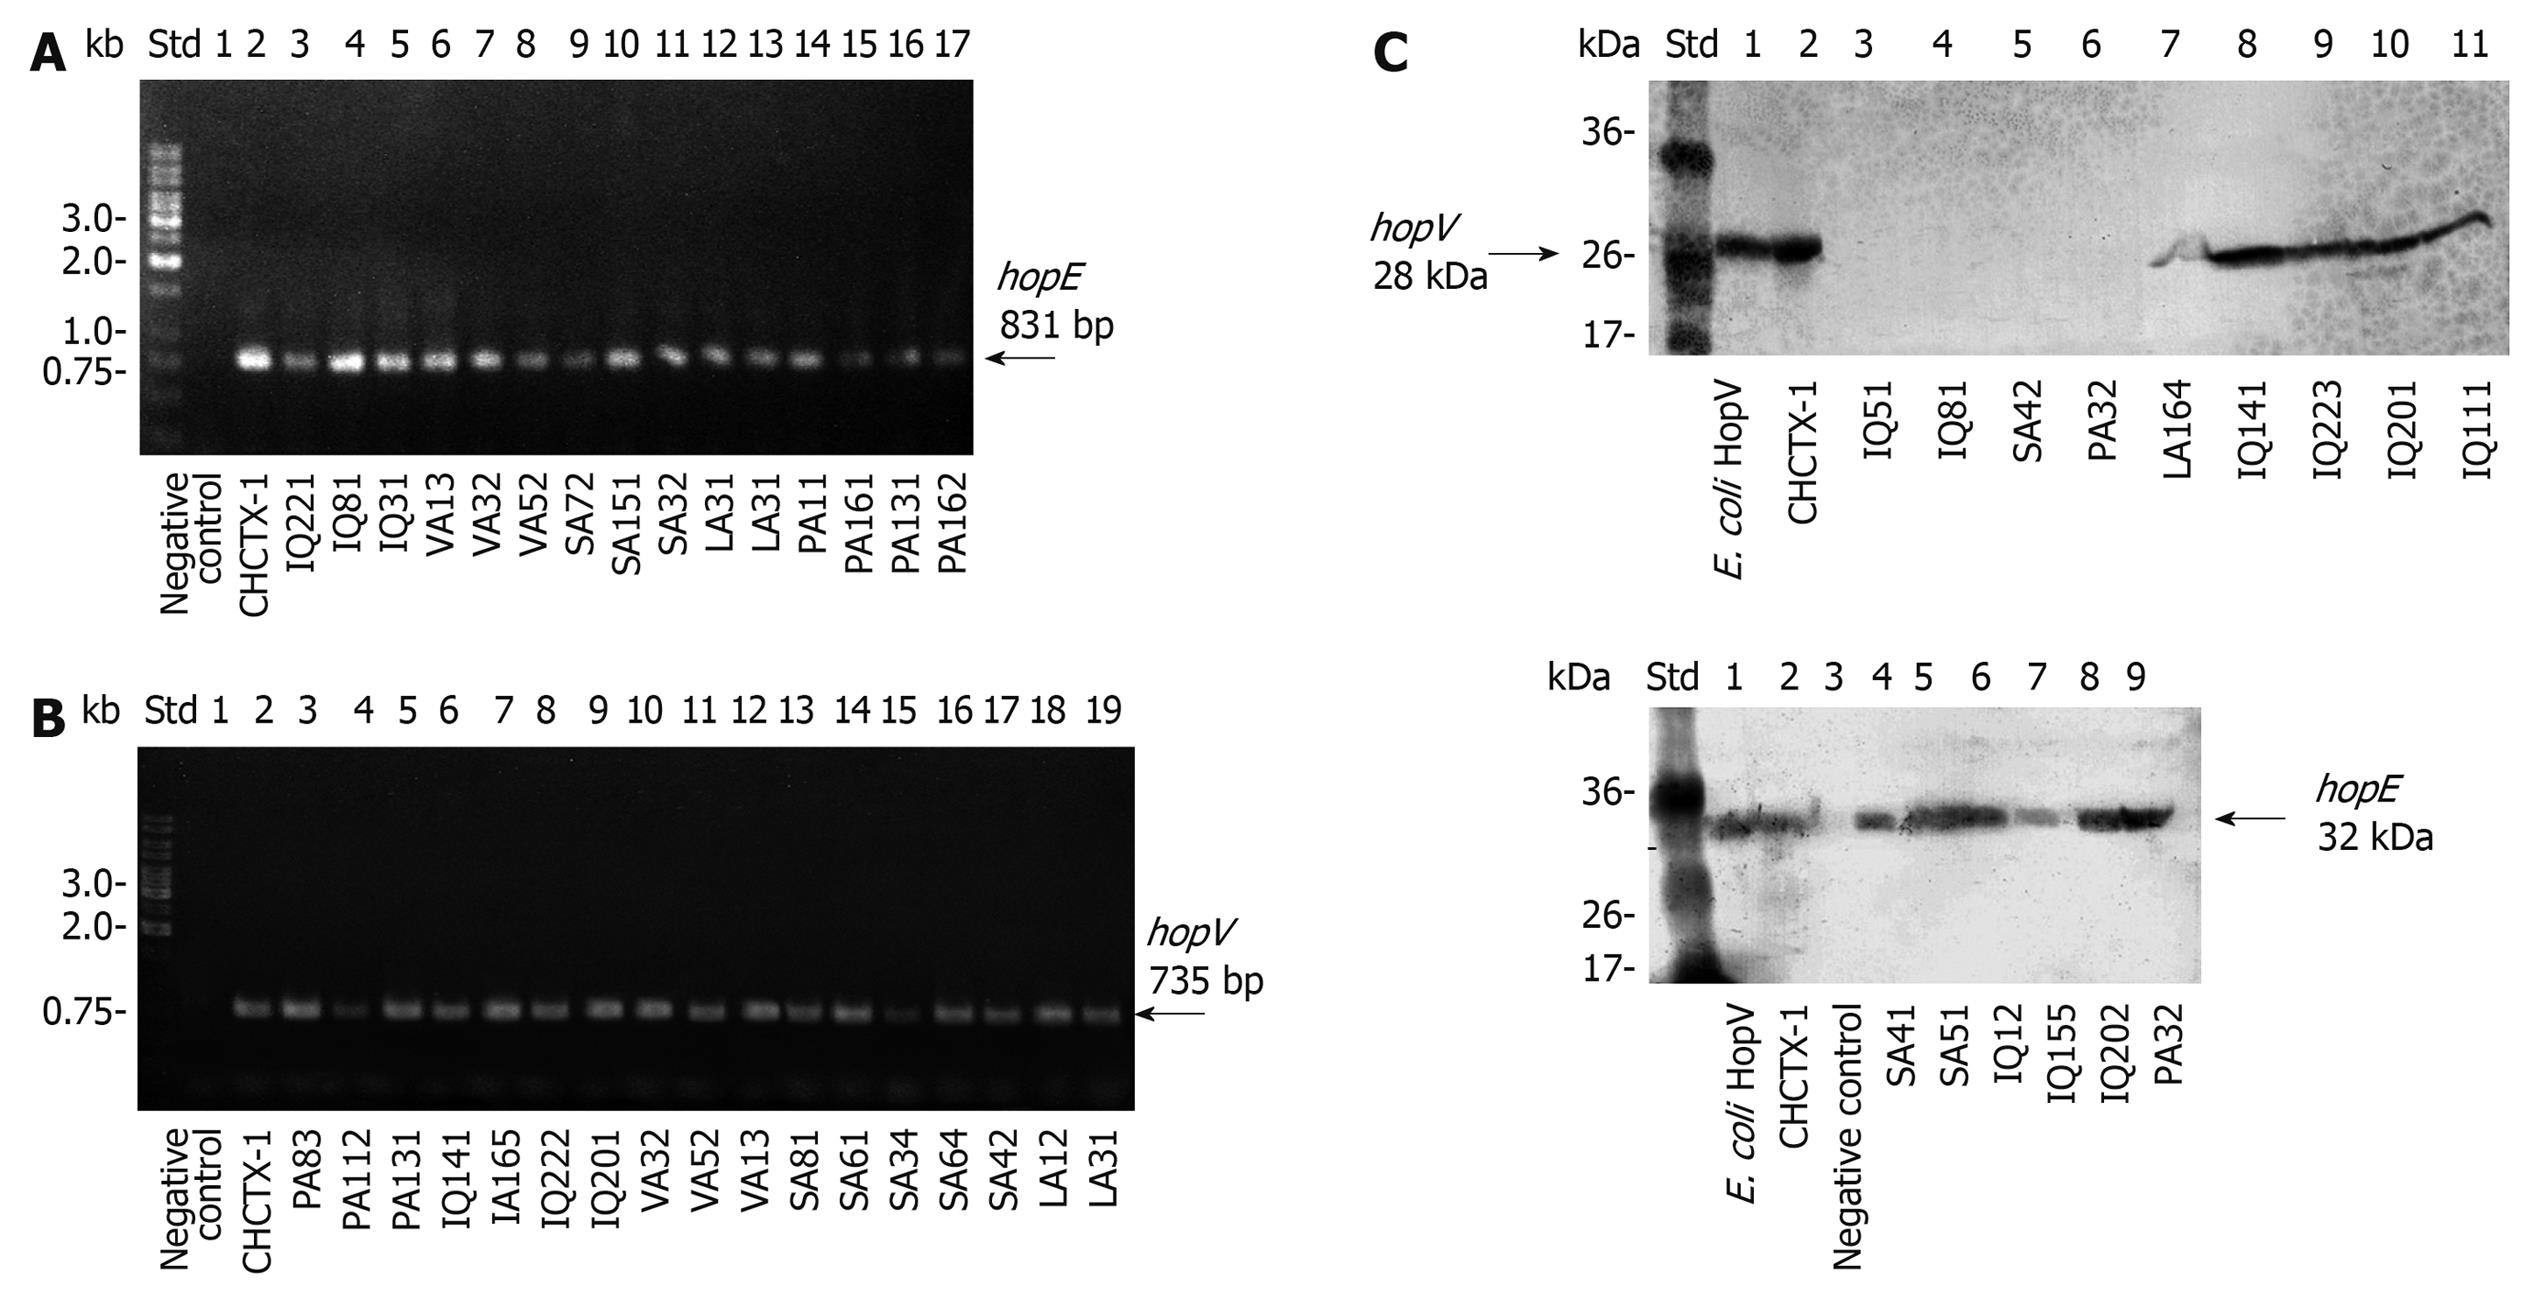
Figure 3 Detection of hopE and hopV genes and their expression in H.
pylori clinical isolates from different Chilean cities. Amplicons were separated in 1% agarose gels. A: PCR detection of the hopE gene; B: PCR detection of the hopV gene. Arrows indicate migration of the respective gene fragments. Lane Std: 1 kb DNA ladder standard (Fermentas); Lane Std2: Lambda DNA/HindIII marker (Fermentas); C: Expression of HopV and HopE porins in H. pylori Chilean strains separated by 12% SDS-PAGE gels and detected by Western blots with respective polyclonal antibodies. Clinical isolates are indicated under the respective lanes. Std: Prestained molecular weight marker (Fermentas). The CHCTX-1 strain was included as a positive control.
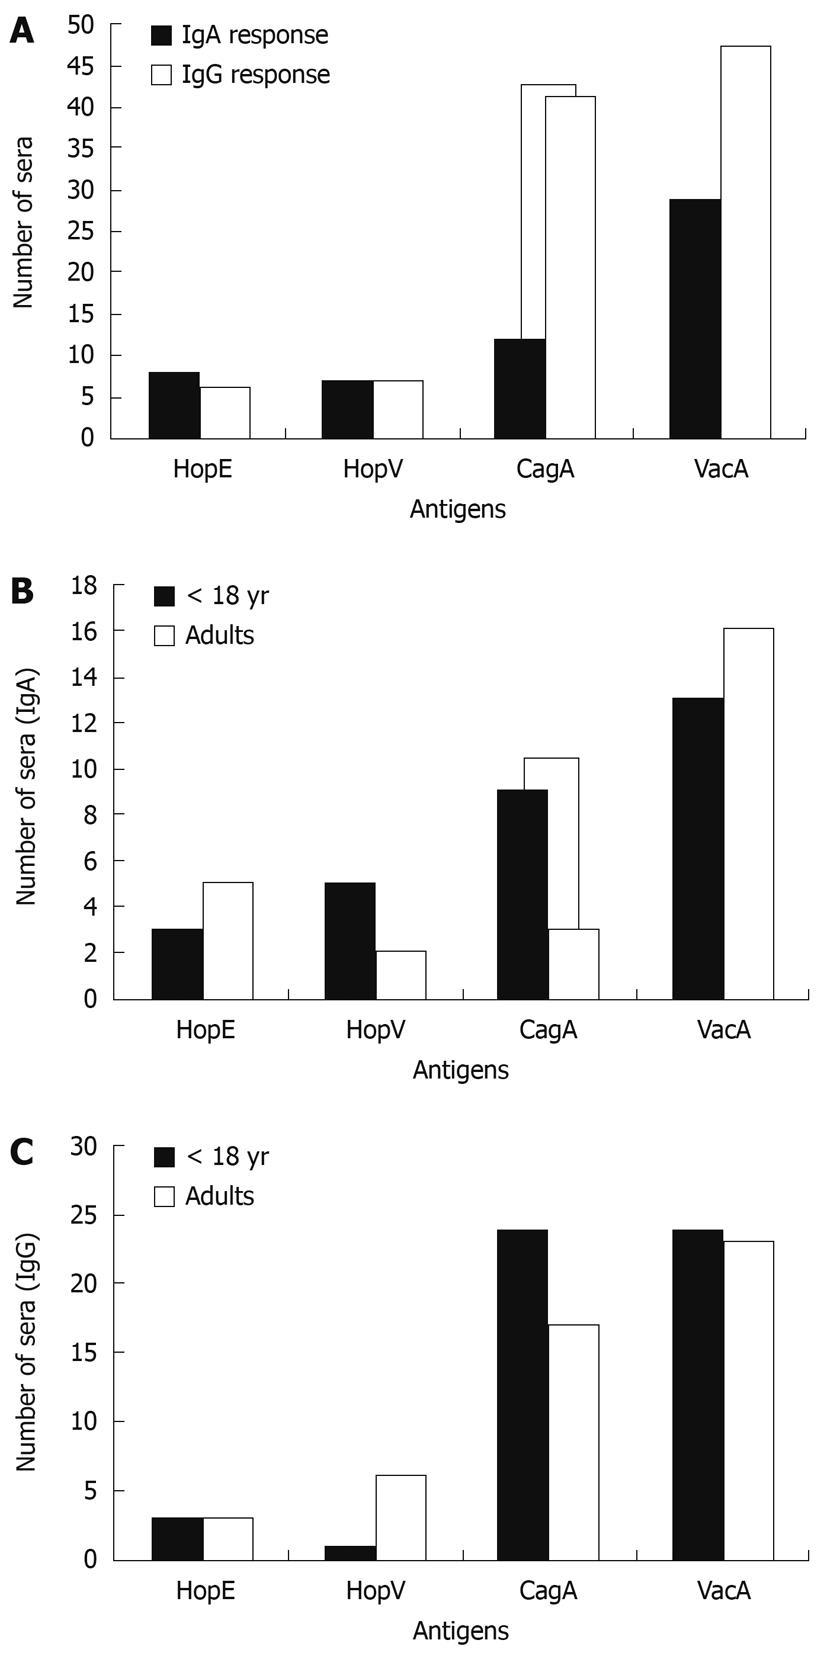
Figure 4 Frequency of recognition of 4 H.
pylori antigens by human sera. Bars represent number of immunoreactive human sera from a panel of 69 H. pylori-infected patients showing IgG- and IgA-type immunoreactivity tested by Western blotting assays on E. coli lysates expressing separately HopE, HopV, CagA and VacA cloned antigens. A: Frequency of IgA- and IgG-type immune responses (as number of sera) which reacted with lysates containing one of these antigens; B: IgA response data taken from panel A, with patients separated by age into 2 groups: under 18 years old and adults; C: IgG response data taken from panel A, separated by age as above. As negative controls, sera from 8 non-infected patients did not display any immune response when tested with these antigens (not shown). Fisher’s test was used for statistical analysis, and significance lower than 0.05 is indicated.
-
Citation: Lienlaf M, Morales JP, Díaz MI, Díaz R, Bruce E, Siegel F, León G, Harris PR, Venegas A.
Helicobacter pylori HopE and HopV porins present scarce expression among clinical isolates. World J Gastroenterol 2010; 16(3): 320-329 - URL: https://www.wjgnet.com/1007-9327/full/v16/i3/320.htm
- DOI: https://dx.doi.org/10.3748/wjg.v16.i3.320


