Copyright
©2010 Baishideng.
World J Gastroenterol. Jul 28, 2010; 16(28): 3529-3540
Published online Jul 28, 2010. doi: 10.3748/wjg.v16.i28.3529
Published online Jul 28, 2010. doi: 10.3748/wjg.v16.i28.3529
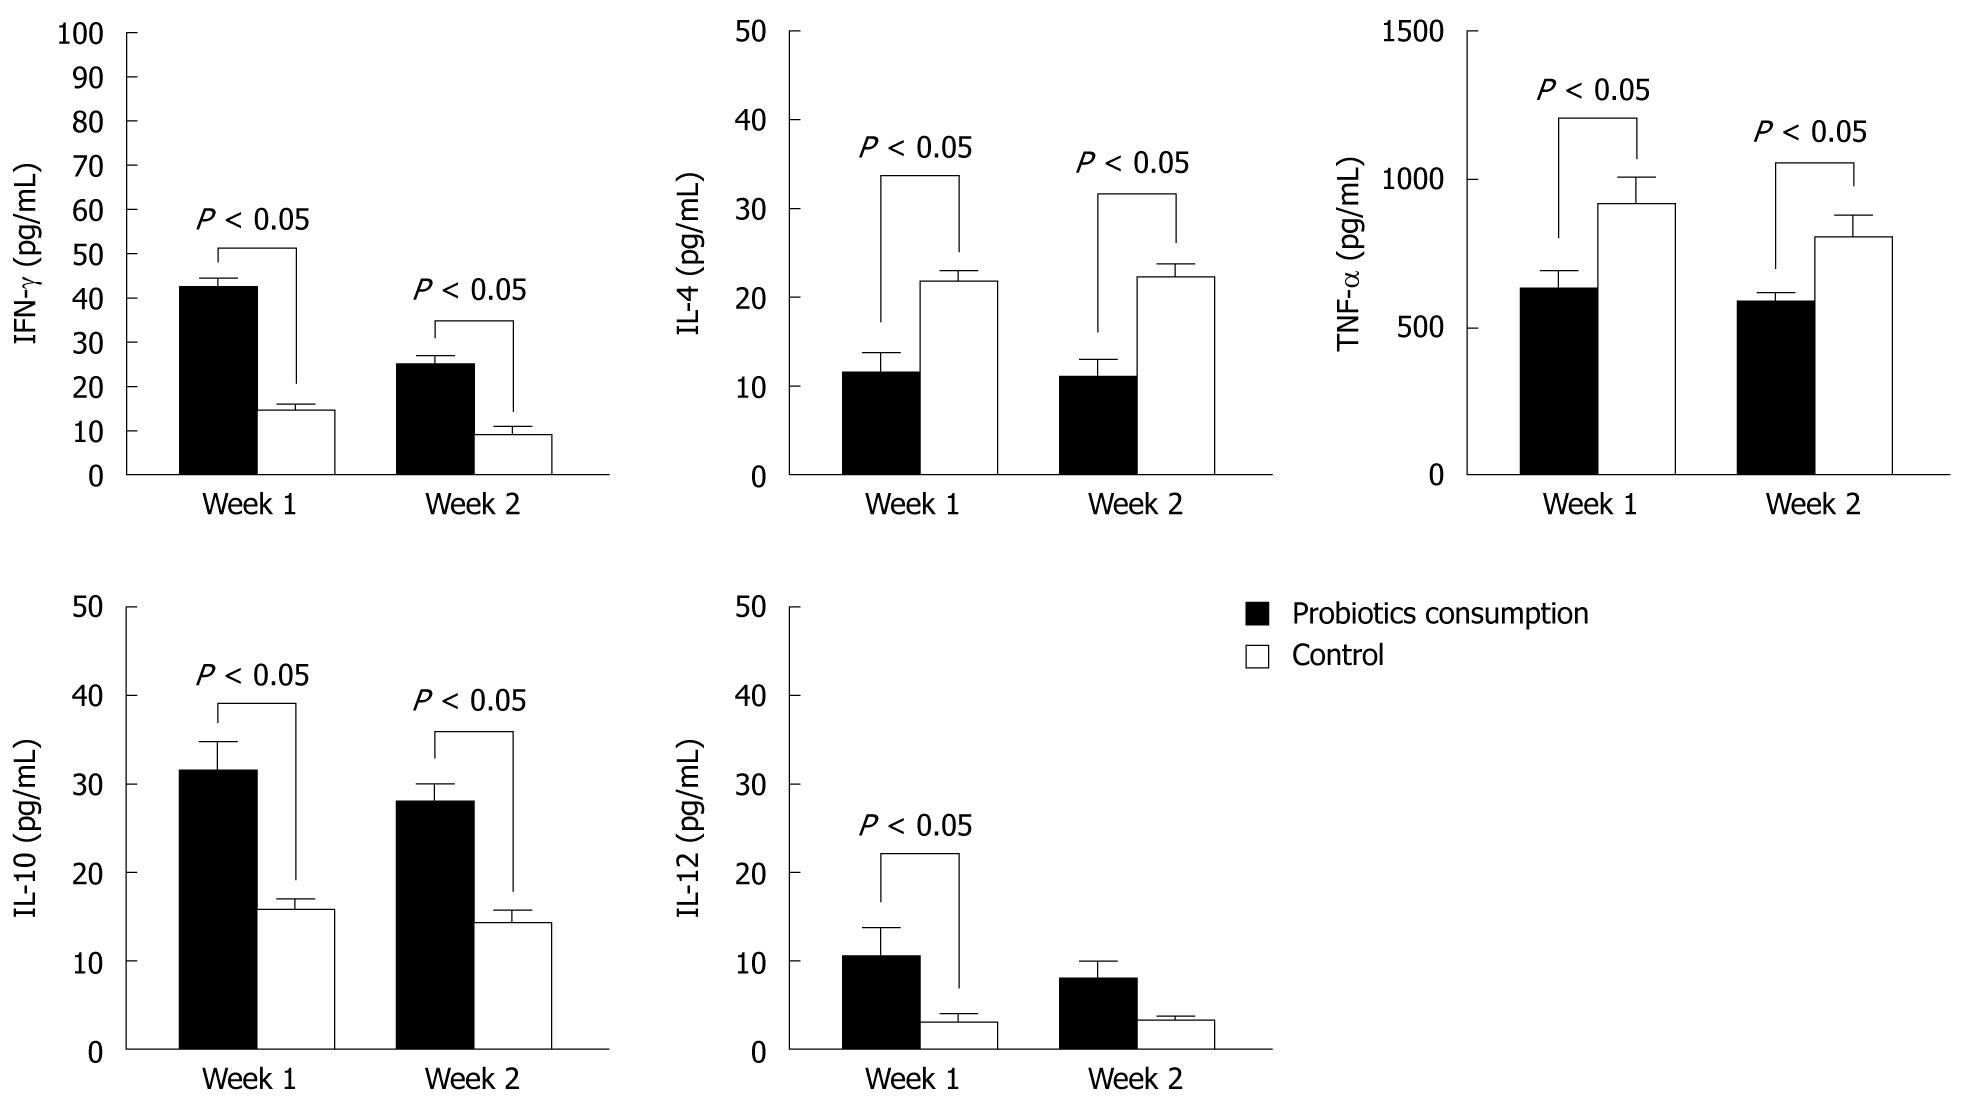
Figure 1 Effects of Bio-Three on peripheral blood mononuclear cells isolated from blood donors.
Concentrations of interferon-γ (IFN-γ), interleukin (IL)-4, tumor necrosis factor-α (TNF-α), IL-10, and IL-12 p70 in the supernatants of peripheral blood mononuclear cells (PBMCs) (105 cells/mL) incubated for 12 h were determined by enzyme-linked immunosorbent assay. The data shown are the values of different cytokines in the supernatants of PBMCs, which were collected at 1 and 2 wk after Bio-Three consumption, compared with controls. The results are presented as the mean ± SD.
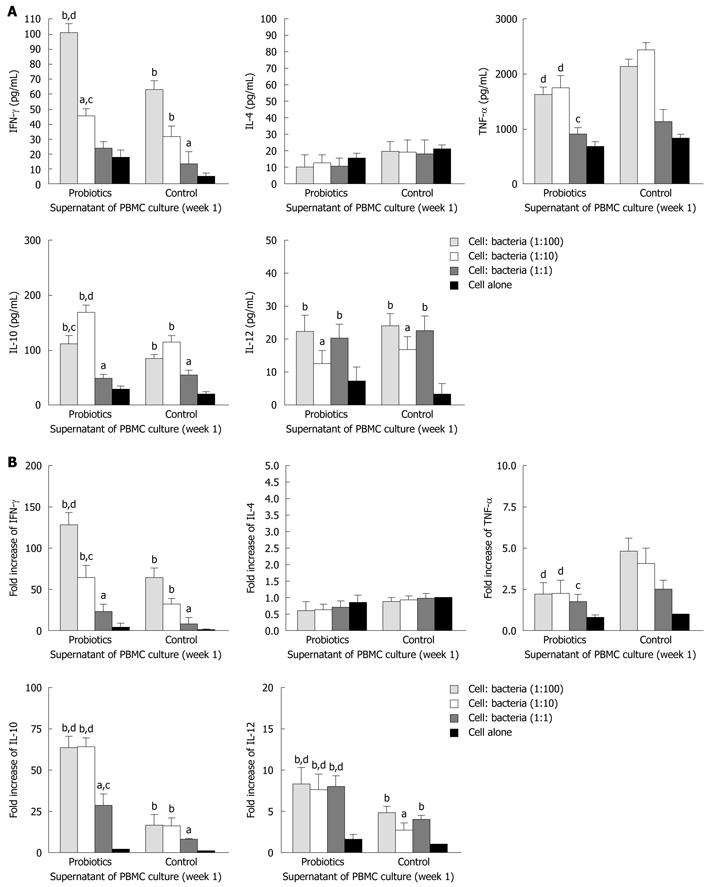
Figure 2 Effects of Bio-Three re-stimulation on cytokine production of peripheral blood mononuclear cells isolated at 1 wk after consumption, compared with controls.
Peripheral blood mononuclear cells (PBMCs) (105 cells/mL) were stimulated at a host cell: bacteria ratio of 1:1, 1:10 and 1:100. A: At 24 h after bacterial stimulation, cell culture supernatants were collected and cytokine levels were determined by enzyme-linked immunosorbent assay; B: The remaining cells in the culture plates were mixed with TRIzol Reagent, and cytokine mRNA expression was analyzed by real-time polymerase chain reaction. The fold increases were compared to that of control cells, which was set at 1. The columns represent the means and the error bars indicate the SD. aP < 0.05, bP < 0.01 vs control cells; cP < 0.05, dP < 0.01 vs controls at the same host cell:bacteria ratio. IFN-γ: Interferon-γ; IL-4: Interleukin-4; TNF-α: Tumor necrosis factor-α.
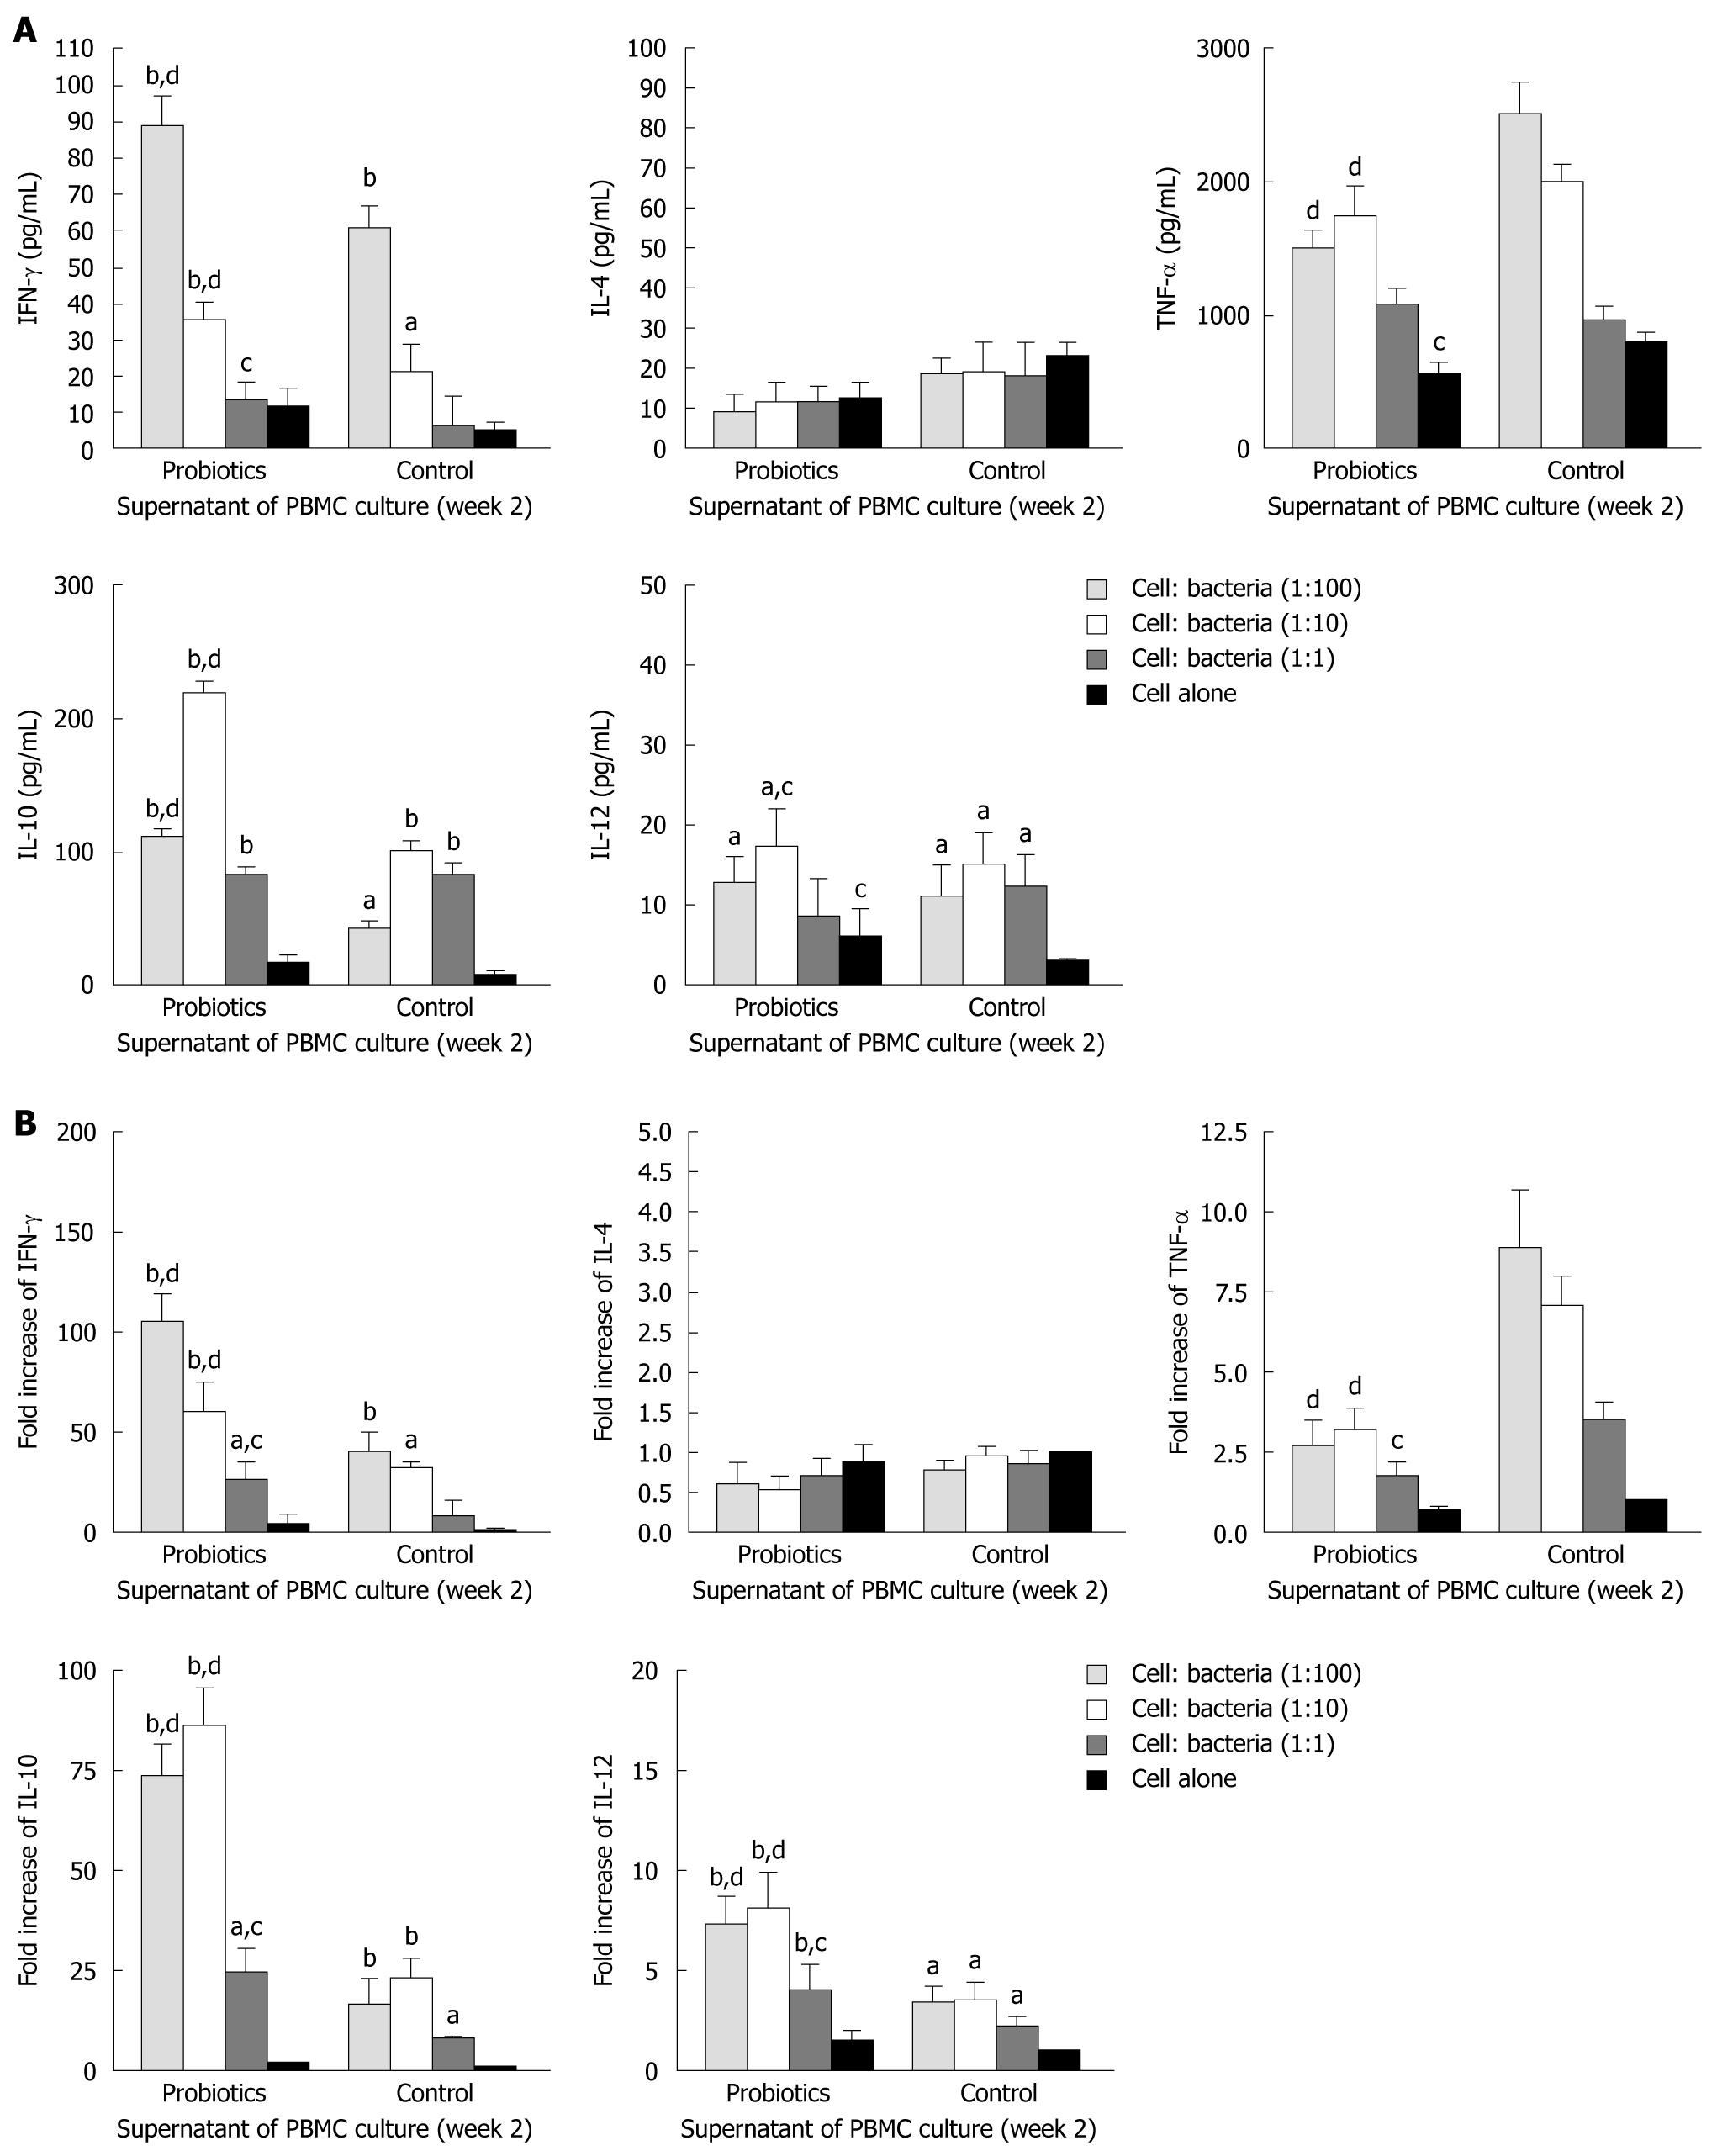
Figure 3 Effects of Bio-Three re-stimulation on cytokine production in peripheral blood mononuclear cells isolated at 2 wk after consumption, compared with controls.
Peripheral blood mononuclear cells (PBMCs) (105 cells/mL) were stimulated at a host cell: bacteria ratio of 1:1, 1:10 and 1:100. A: At 24 h after bacterial stimulation, cell culture supernatants were collected and cytokine levels were determined by enzyme-linked immunosorbent assay; B: The remaining cells in the culture plates were mixed with TRIzol Reagent, and cytokine mRNA expression was analyzed by real-time polymerase chain reaction. The fold increases were compared to that of control cells, which was set at 1. The columns represent the means and error bars indicate the SD. aP < 0.05, bP < 0.01 vs control cells; cP < 0.05, dP < 0.01 vs controls at the same host cell:bacteria ratio. IFN-γ: Interferon-γ; IL-4: Interleukin-4; TNF-α: Tumor necrosis factor-α.
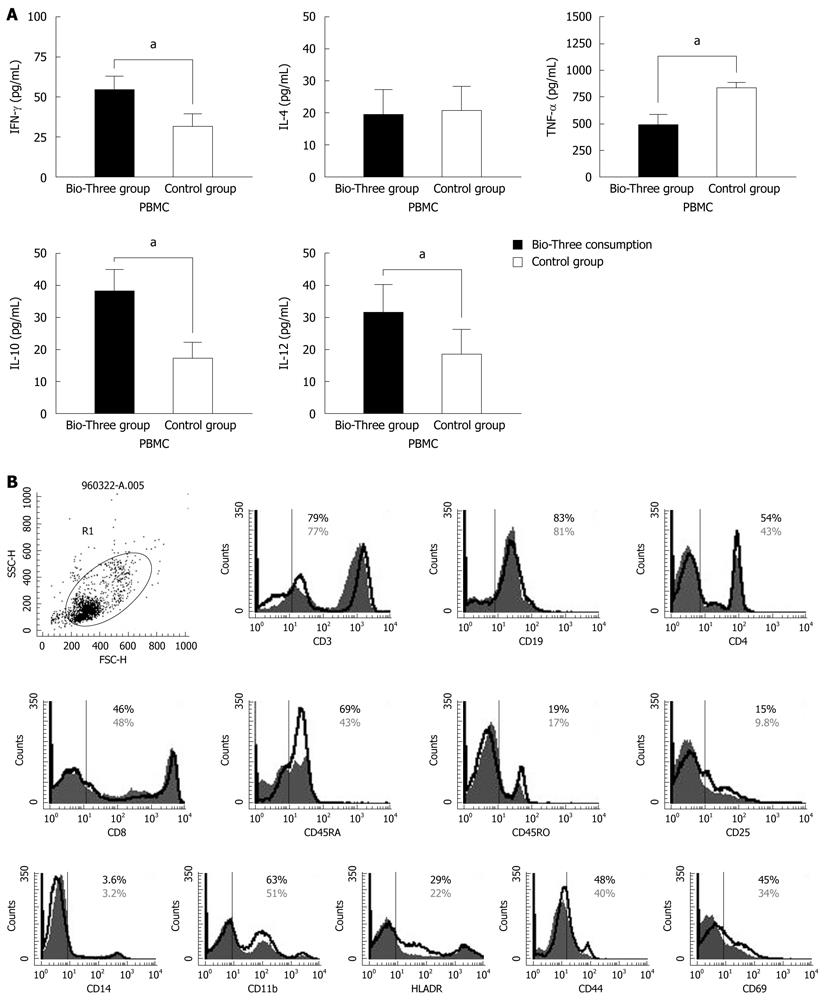
Figure 4 Measuring initial cytokine levels and determining immune phenotype distributions in peripheral blood mononuclear cells isolated from blood donors.
A: Initial concentrations of interferon-γ (IFN-γ), interleukin (IL)-4, tumor necrosis factor-α (TNF-α), IL-10, and IL-12 p70 in the supernatants of human peripheral blood mononuclear cells (PBMCs) were determined by enzyme-linked immunosorbent assay. The results are presented as the mean ± SD. Statistically significant differences compared with the controls (aP < 0.05); B: To determine the effect of Bio-Three on PBMCs, phenotypic analysis of the immune response was studied. The solid histogram shows the control results, and the unshaded area shows the level of expression of co-stimulatory molecules after Bio-Three consumption. The data shown are representative of three experiments performed. Probiotics might enhance expression of CD4, CD45RB, CD44, CD69, CD25, CD11b and HLA-DR, which indicates alternation of co-stimulatory markers of T helper cells and dendritic cells.
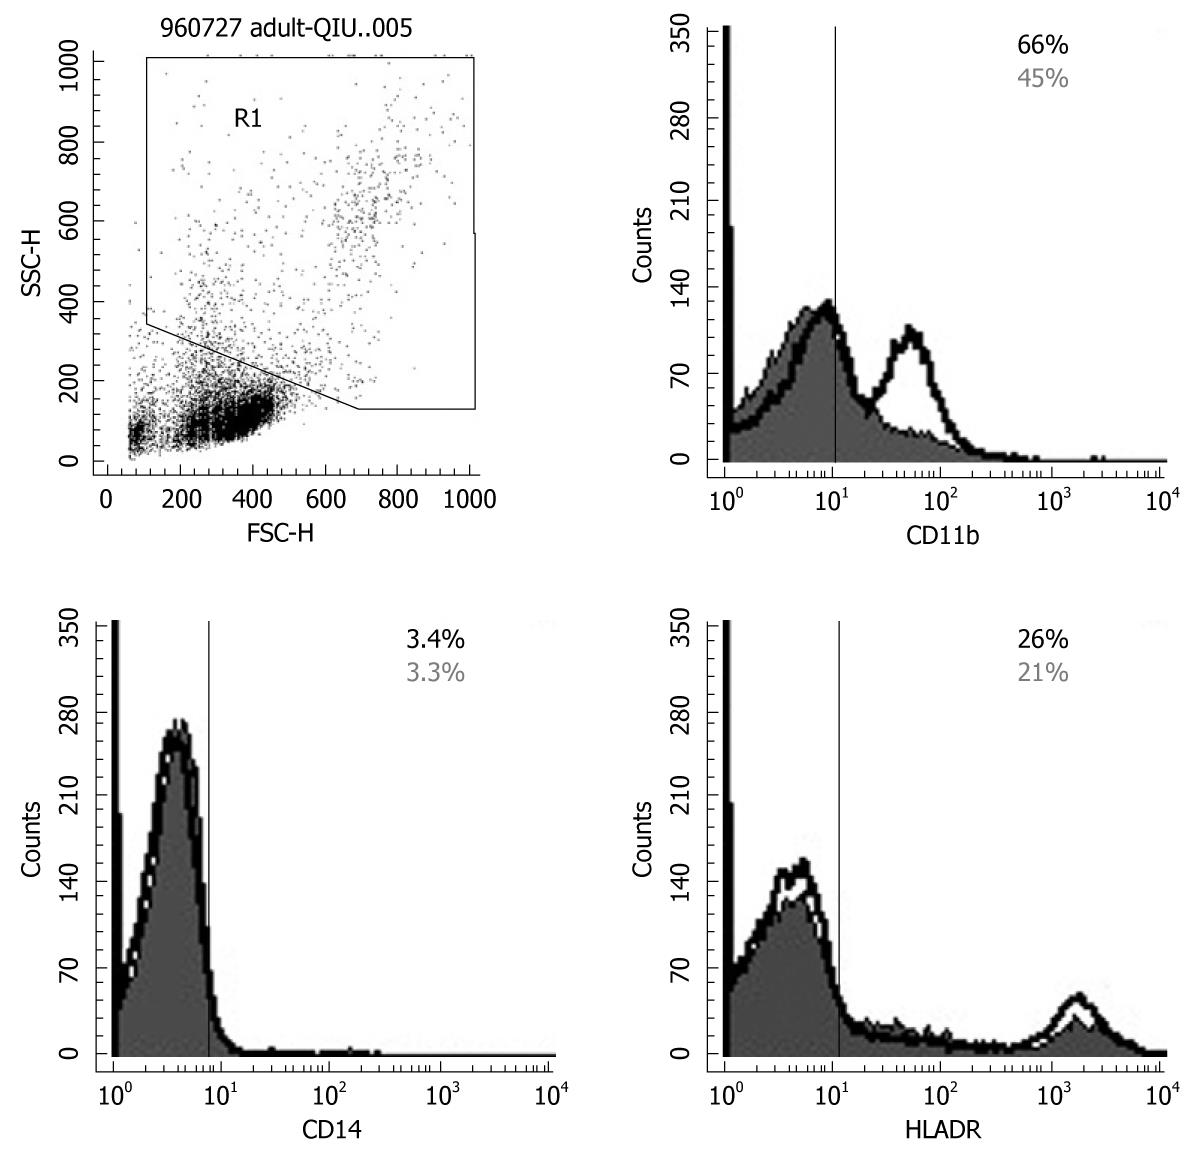
Figure 5 Flow cytometry results for CD14, CD11b and HLA-DR expression on monocytes and granulocytes.
Probiotics can enhance expression of CD11b and HLA-DR by gating monocytes and granulocytes. The solid histogram shows results for controls, and the unshaded area shows the level of expression of co-stimulatory molecules after Bio-Three treatment. The data shown are representative of three experiments performed.
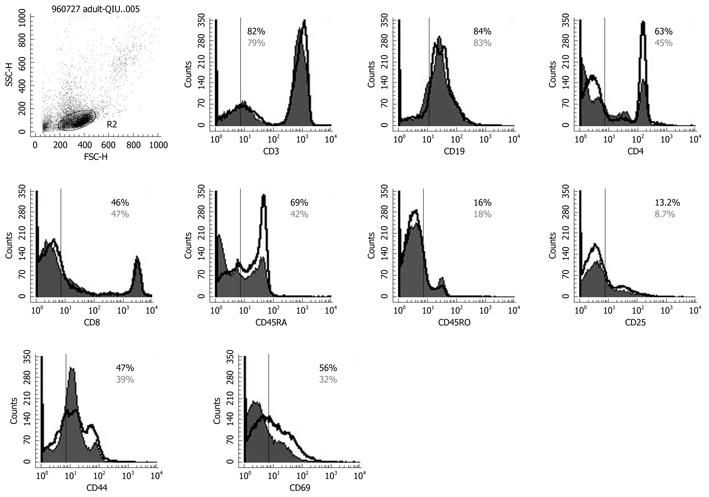
Figure 6 Flow cytometry results for CD3, CD4, CD45RA, CD45RO, CD8, CD19, CD25, CD44, CD69 expression on peripheral lymphocytes.
The solid histogram shows the results for controls, and the unshaded area shows the level of expression of co-stimulatory molecules after Bio-Three treatment. The data shown are representative of three experiments performed. Bio-Three might alter the expression of T-cell surface phenotype, such as CD4, C45RA, CD44, CD69, and even CD25.
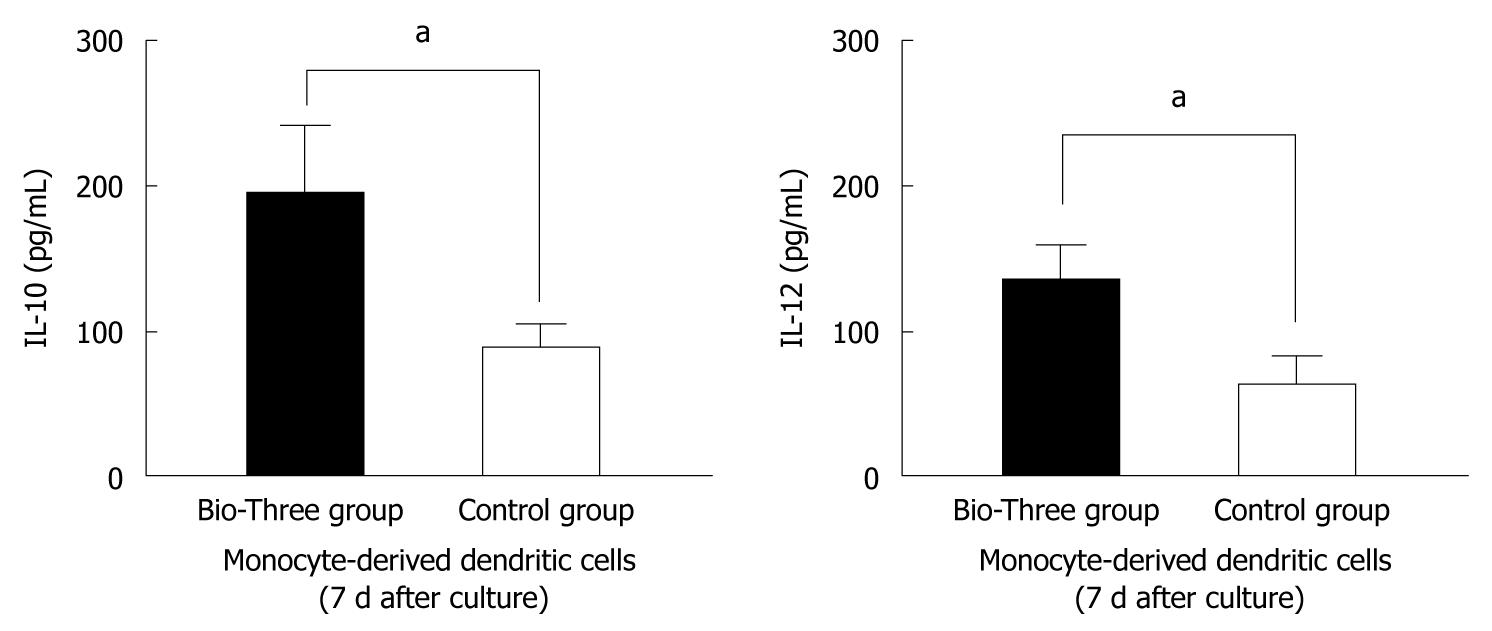
Figure 7 Interleukin-10 and interleukin-12 p70 levels in the supernatants of monocyte-derived dendritic cells.
The data shown are the levels of cytokines in the probiotic group (black bar), and control group (white bar) collected on day 7 after Bio-Three consumption. Bio-Three upregulated interleukin (IL)-10 and IL-12 p70 levels in the supernatants of monocyte-derived dendritic cells. The results are presented as the mean ± SD. Statistically significant differences compared with the controls (aP < 0.05).
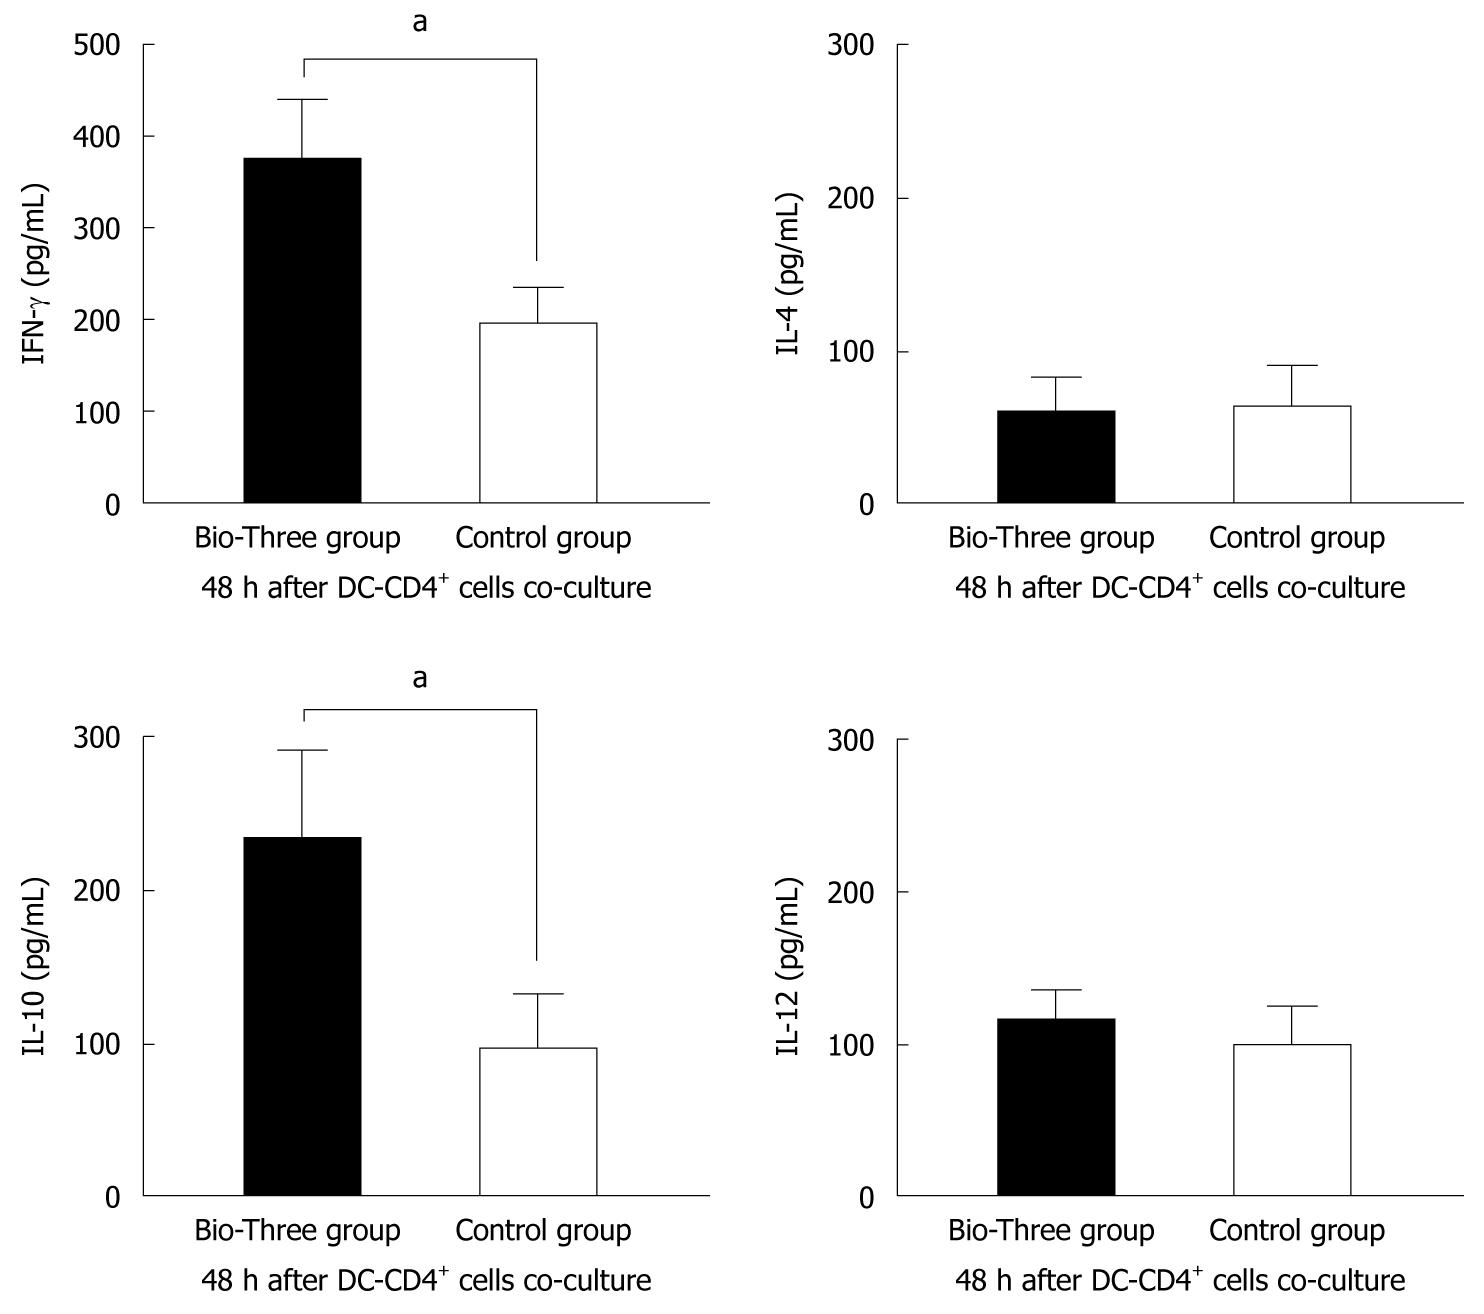
Figure 8 Interferon-γ, interleukin-4, interleukin-10, and interleukin-12 p70 cytokine profile of supernatants of human CD4+ T cells co-cultured with dendritic cells.
The data shown are the levels of cytokines in the probiotic group (black bar), and control group (white bar). Bio-Three upregulated interferon-γ (IFN-γ) and interleukin (IL)-10 levels in the supernatants of CD4+ T cells co-cultured with dendritic cells at a ratio of 1:4 for 48 h. The results are presented as the mean ± SD. Statistically significant differences compared with the controls (aP < 0.05).
- Citation: Hua MC, Lin TY, Lai MW, Kong MS, Chang HJ, Chen CC. Probiotic Bio-Three induces Th1 and anti-inflammatory effects in PBMC and dendritic cells. World J Gastroenterol 2010; 16(28): 3529-3540
- URL: https://www.wjgnet.com/1007-9327/full/v16/i28/3529.htm
- DOI: https://dx.doi.org/10.3748/wjg.v16.i28.3529


