Copyright
©2010 Baishideng.
World J Gastroenterol. May 21, 2010; 16(19): 2378-2387
Published online May 21, 2010. doi: 10.3748/wjg.v16.i19.2378
Published online May 21, 2010. doi: 10.3748/wjg.v16.i19.2378
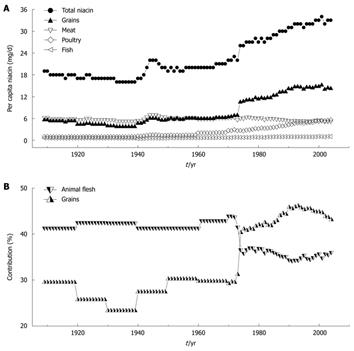
Figure 1 Trends in per capita niacin consumption and contributions of grains and animal flesh to niacin in the US.
A: The trends in total niacin consumed per capita per day in 1909-2004 and in the amounts from grains and animal flesh (meat, poultry and fish); B: Changes in the percentage of grain and animal flesh contribution to dietary niacin. The data on niacin consumption are derived from Ref. 5. The data on the grain and animal flesh contribution to niacin are derived from Ref. 8 (1909-2000) and Ref. 9 (2001-2004). The per capita niacin consumption (A) and the grain contribution to niacin (B) have been suddenly increased since 1974 due to an update in niacin-fortification standards.
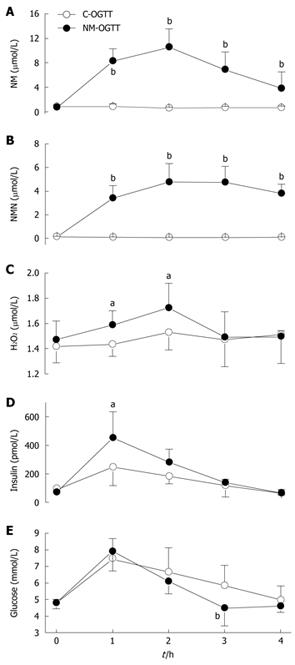
Figure 2 Dynamic effect of nicotinamide on plasma H2O2 level and glucose metabolism.
A-E: Dynamic changes in the concentrations of plasma nicotinamide (NM), N1-methylnicotinamide (NMN), H2O2, insulin and blood glucose in C-OGTT and NM-OGTT (co-administration of 300 mg nicotinamide and 75 g glucose). For each point, n = 5. Values represent mean ± SD, aP < 0.05, bP < 0.01 vs C-OGTT.
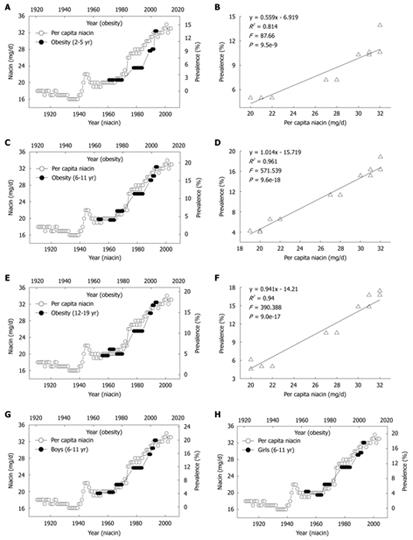
Figure 3 Correlations between US per capita niacin consumption and obesity prevalence in US children.
A, C and E: The trends in the daily per capita niacin consumption in 1909-2004 (Ref. 5) and in the obesity prevalence in the children aged 2-5, 6-11 and 12-19 years (Ref. 28); B, D and F: The 10-year lag-regression plots of the obesity prevalence in different age groups against daily per capita niacin consumption using the data in A, C, and E; G and H: The obesity prevalence in the age group of 6-11 years of either sex in 1963-2004 (Ref. 29 and 30) increased in parallel with the per capita niacin consumption in 1953-1994.
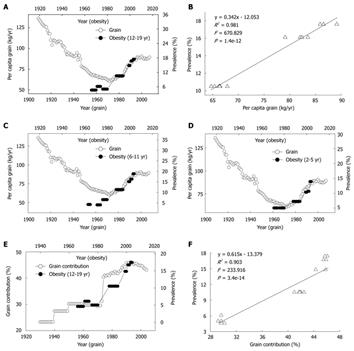
Figure 4 Correlations between consumption and contribution of grain and prevalence of obesity in US children.
A: Trends in US per capita grain consumption in 1909-2007 (Ref. 31) and in the obesity prevalence in the children aged 12-19 years in 1966-2004 (Ref. 28); B: The linear regression plot of the obesity prevalence in 1988-2004 against grain consumption in 1978-1994 using the data in A; C and D: Relationships between the grain consumption (Ref. 31) and the prevalence of obesity in the children aged 6-11 and 2-5 years (Ref. 28). R2 = 0.902 (P = 7.1e-7) and 0.955 (P = 9.7e-9), for 2-5 years age group and 6-11 years age group; E: Trends in the grain contribution to niacin (Ref. 8 and Ref. 9) and in the obesity prevalence in the children aged 12-19 years (Ref. 28); F: The linear regression plot of the prevalence of obesity in 1966-2004 against grain contribution in 1956-1994 using the data in E.
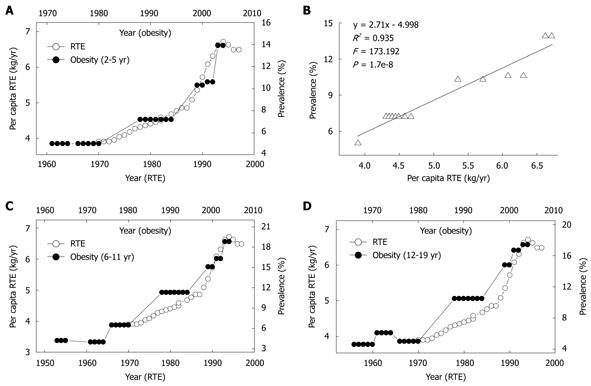
Figure 5 Relationship between per capita ready-to-eat cereal (RTE) consumption and prevalence of obesity in US children.
A: Trends in US per capita RTE consumption in 1970-1997 (Ref. 32) and in the prevalence of obesity in the 2-5 years age group; B: The linear regression plot of the obesity prevalence in 1980-2004 against RET consumption in 1970-1994 using the data in A; C and D: A similar relationship between the RTE consumption and the obesity prevalence in the 6-11 years and 12-19 years age groups.
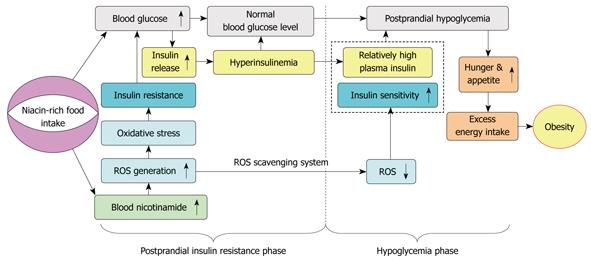
Figure 6 Proposed model of the role of niacin overload in obesity development.
Excess nicotinamide metabolism may induce a biphasic effect: postprandial hyperinsulinemia followed by postprandial hypoglycemia, in which reactive oxygen species (ROS) generation and scavenging may play a central role.
- Citation: Li D, Sun WP, Zhou YM, Liu QG, Zhou SS, Luo N, Bian FN, Zhao ZG, Guo M. Chronic niacin overload may be involved in the increased prevalence of obesity in US children. World J Gastroenterol 2010; 16(19): 2378-2387
- URL: https://www.wjgnet.com/1007-9327/full/v16/i19/2378.htm
- DOI: https://dx.doi.org/10.3748/wjg.v16.i19.2378


