Copyright
©2010 Baishideng.
World J Gastroenterol. May 21, 2010; 16(19): 2378-2387
Published online May 21, 2010. doi: 10.3748/wjg.v16.i19.2378
Published online May 21, 2010. doi: 10.3748/wjg.v16.i19.2378
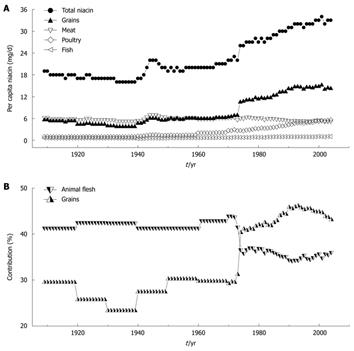
Figure 1 Trends in per capita niacin consumption and contributions of grains and animal flesh to niacin in the US.
A: The trends in total niacin consumed per capita per day in 1909-2004 and in the amounts from grains and animal flesh (meat, poultry and fish); B: Changes in the percentage of grain and animal flesh contribution to dietary niacin. The data on niacin consumption are derived from Ref. 5. The data on the grain and animal flesh contribution to niacin are derived from Ref. 8 (1909-2000) and Ref. 9 (2001-2004). The per capita niacin consumption (A) and the grain contribution to niacin (B) have been suddenly increased since 1974 due to an update in niacin-fortification standards.
- Citation: Li D, Sun WP, Zhou YM, Liu QG, Zhou SS, Luo N, Bian FN, Zhao ZG, Guo M. Chronic niacin overload may be involved in the increased prevalence of obesity in US children. World J Gastroenterol 2010; 16(19): 2378-2387
- URL: https://www.wjgnet.com/1007-9327/full/v16/i19/2378.htm
- DOI: https://dx.doi.org/10.3748/wjg.v16.i19.2378


