Copyright
©2010 Baishideng.
World J Gastroenterol. May 14, 2010; 16(18): 2244-2251
Published online May 14, 2010. doi: 10.3748/wjg.v16.i18.2244
Published online May 14, 2010. doi: 10.3748/wjg.v16.i18.2244
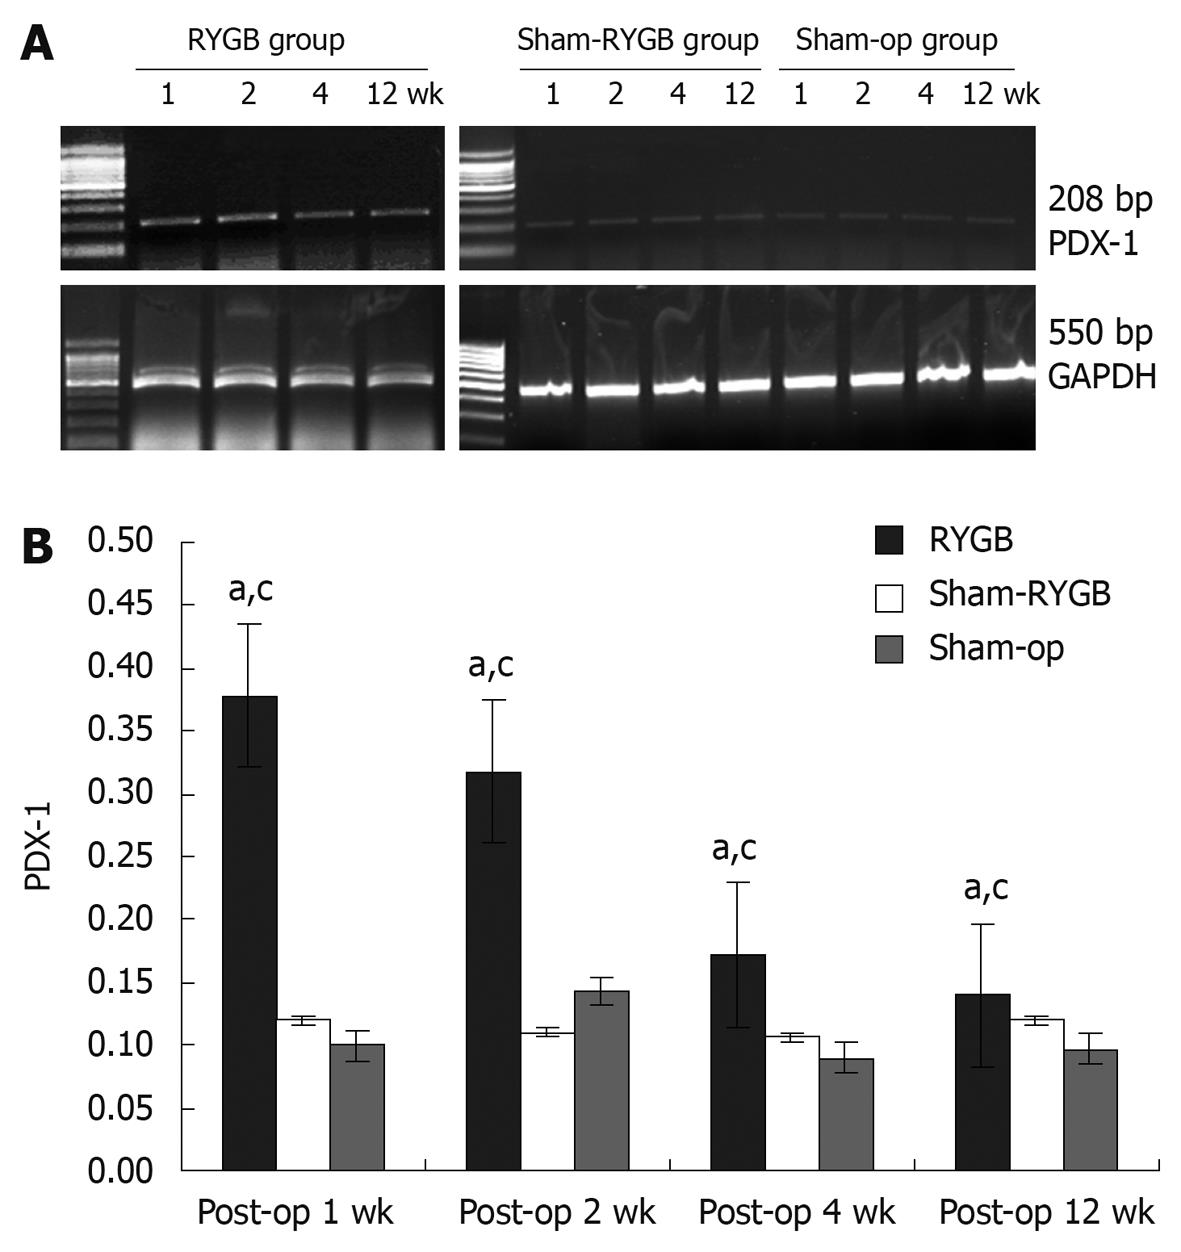
Figure 1 The expression of PDX-1 mRNA in the pancreas of GK rats.
A: Representative gel from RT-PCR with primers to PDX-1 (208 bp) and GAPDH (550 bp); B: The intensities of PDX-1 mRNA bands relative to those of GAPDH bands. aP < 0.05 vs sham-RYGB; cP < 0.05 vs sham-op group.
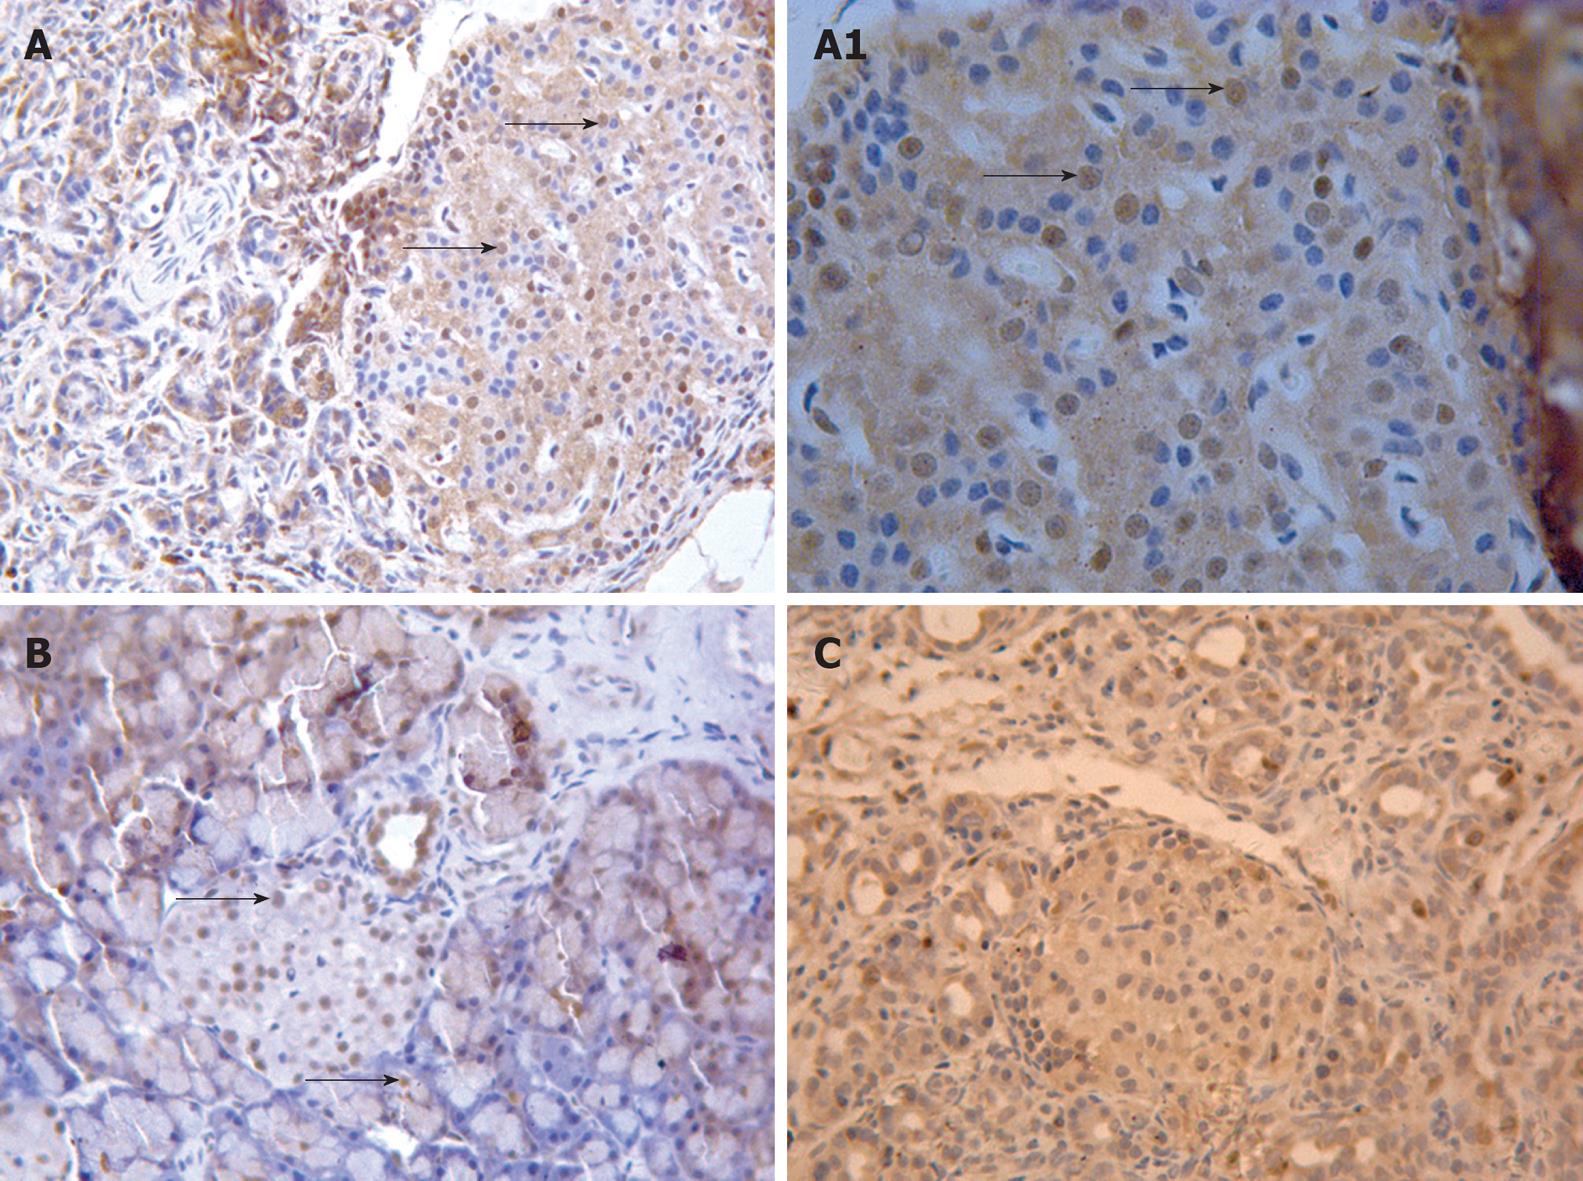
Figure 2 The expression of PDX-1 protein in the pancreas of GK rats.
PDX-1 positive signals were stained in dark brown color (arrows), and mainly located the islets. Occasionally, they were found in the duct and acinar cells. A, B and A1 in RYGB group; C in sham-op group. (Hematoxylin & anti-PDX-1 IHC stain. A, B and C at 200 × magnifications; A1, at 400 × magnifications).
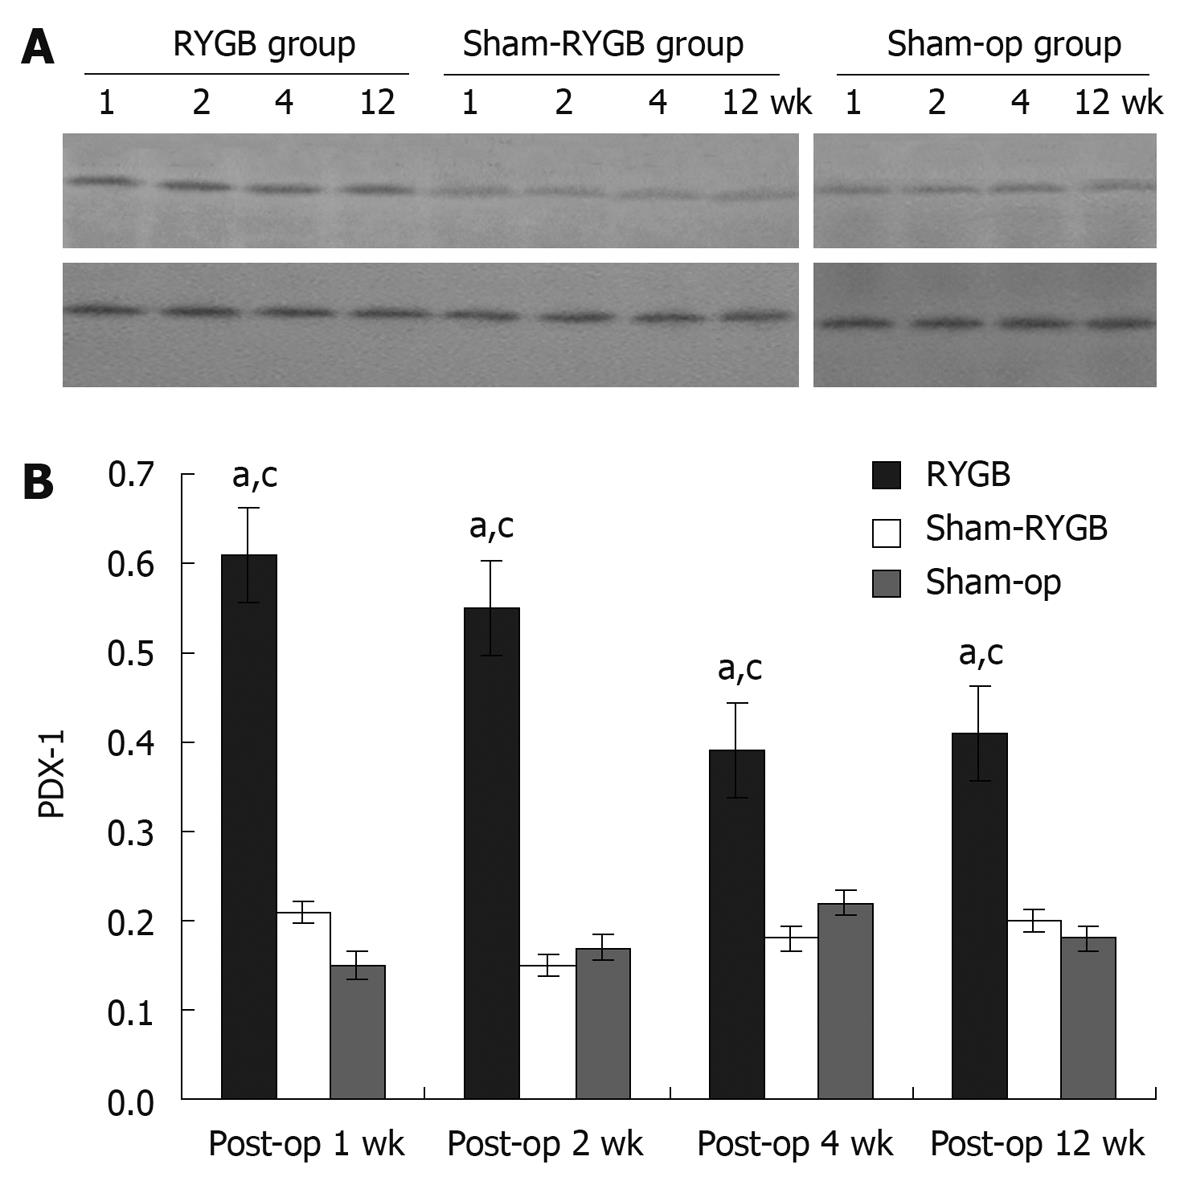
Figure 3 Western blotting analysis of PDX-1.
A: Representative Western blotting analysis of PDX-1 protein; B: The relative expression level of PDX-1 protein. aP < 0.05 vs sham-RYGB; cP < 0.05 vs sham-op group.
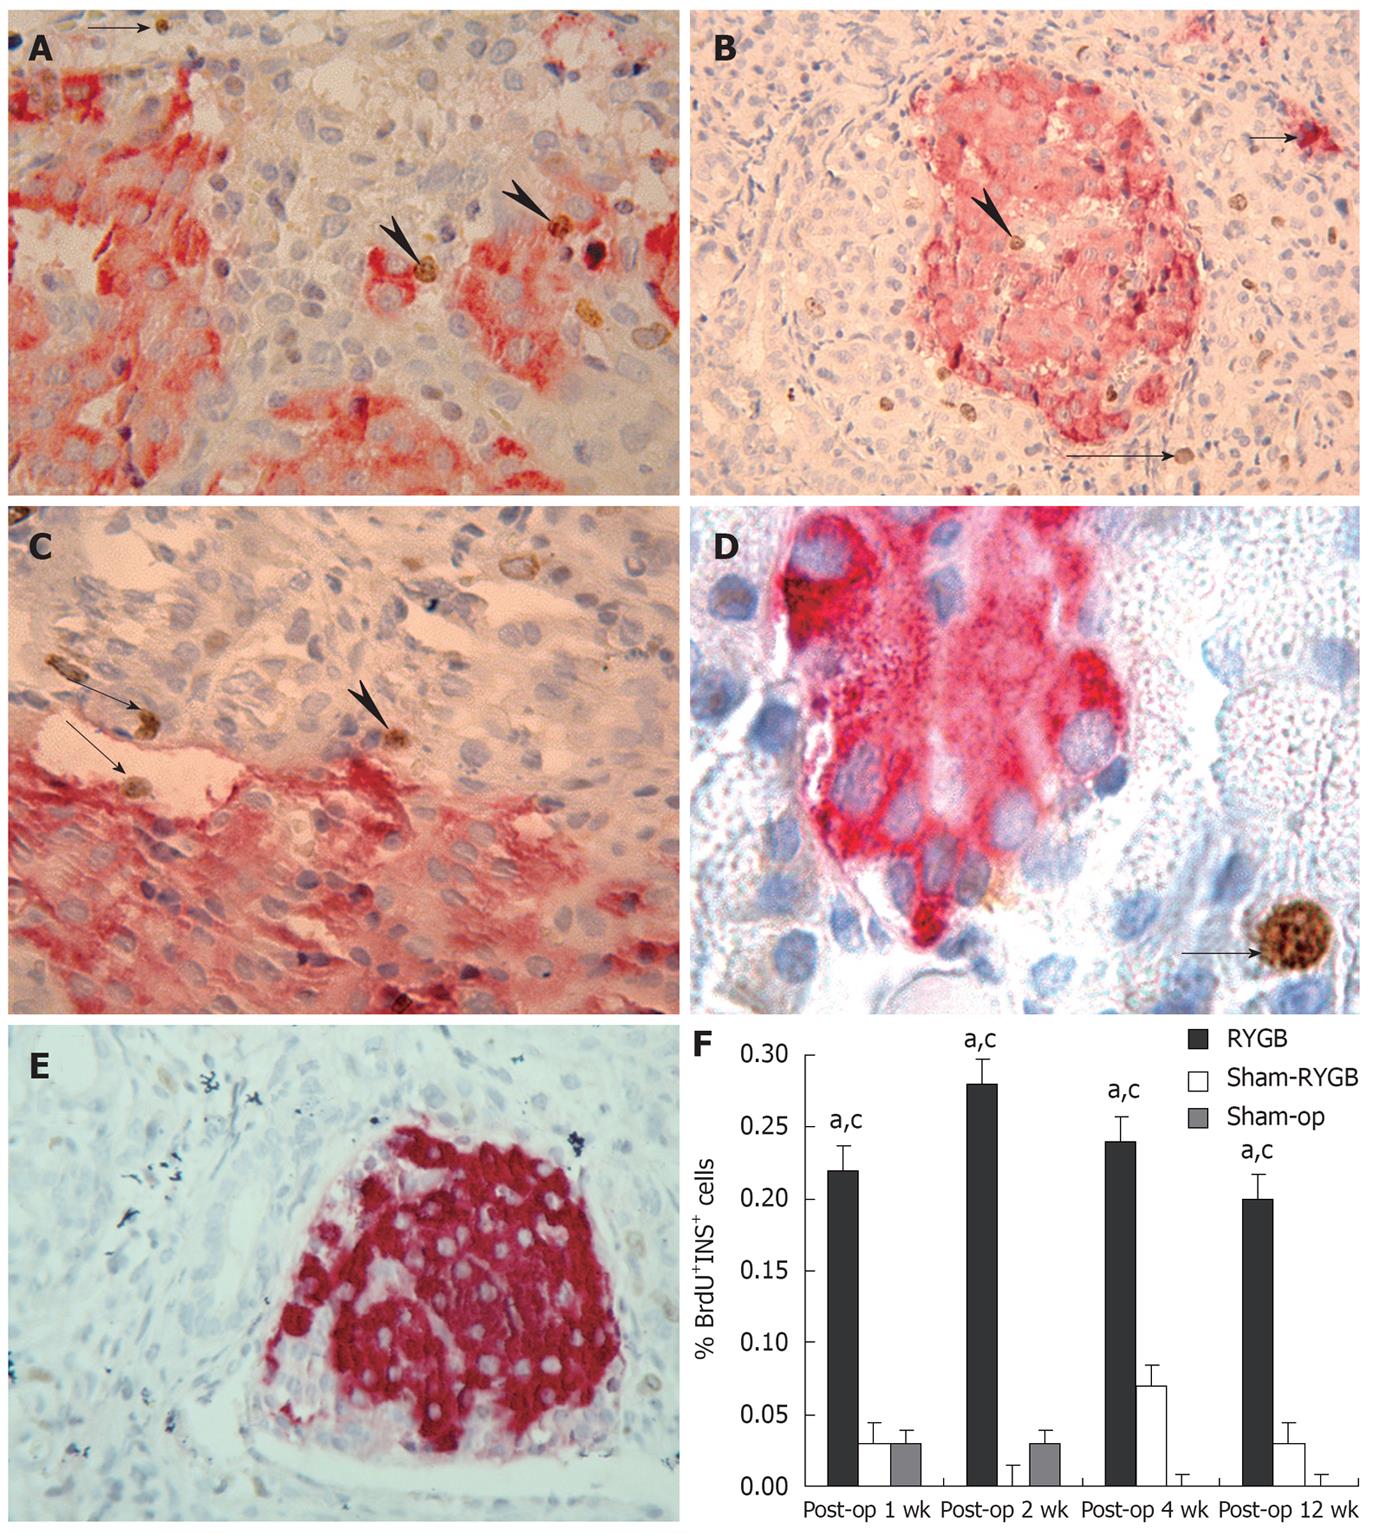
Figure 4 Anti-Brdu and -insulin double IHC staining.
A: Brdu and insulin double positive cells in the islets or acini (arrowheads), single Brdu positive cells in the acini (thin-tail arrow); B: Brdu and insulin double positive cells in the islets (arrowhead) and single Brdu positive cells in the acini (thin-tail arrow), insulin positive cells in the acini (short-tail arrow); C: Brdu and insulin double positive cells in the ducts (thin-tail arrows) and islets (arrowhead); D: Single Brdu positive cells in the acini (thin-tail arrow); E: No Brdu and insulin double labeling cells in the pancreas of sham-RYGB rats; F: The index of Brdu and insulin double positive cells. (A and C at 400 × magnifications; B and E at 200 × magnifications; D at 1000 × magnifications). aP < 0.05 vs sham-RYGB; cP < 0.05 vs sham-op group.
- Citation: Li Z, Zhang HY, Lv LX, Li DF, Dai JX, Sha O, Li WQ, Bai Y, Yuan L. Roux-en-Y gastric bypass promotes expression of PDX-1 and regeneration of β-cells in Goto-Kakizaki rats. World J Gastroenterol 2010; 16(18): 2244-2251
- URL: https://www.wjgnet.com/1007-9327/full/v16/i18/2244.htm
- DOI: https://dx.doi.org/10.3748/wjg.v16.i18.2244


