Copyright
©2010 Baishideng.
World J Gastroenterol. Mar 14, 2010; 16(10): 1201-1208
Published online Mar 14, 2010. doi: 10.3748/wjg.v16.i10.1201
Published online Mar 14, 2010. doi: 10.3748/wjg.v16.i10.1201
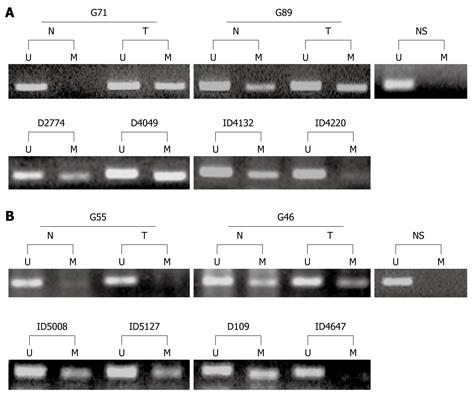
Figure 1 Methylation specific polymerase chain reaction (MSP) analyses of methylation status of the GATA-4 (A) and GATA-5 (B) CpG islands in human gastric mucosa samples.
The upper panel shows MSP results of gastric cancer tissues (T) and their corresponding non-neoplastic tissues (N). The lower panel shows results of gastric dysplasia. The unmethylated (lanes U) and methylated (lanes M) MSP products were displayed on 2.5% agarose gels. NS: Normal stomach mucosa; D: Definite dysplasia; ID: Indefinite dysplasia.
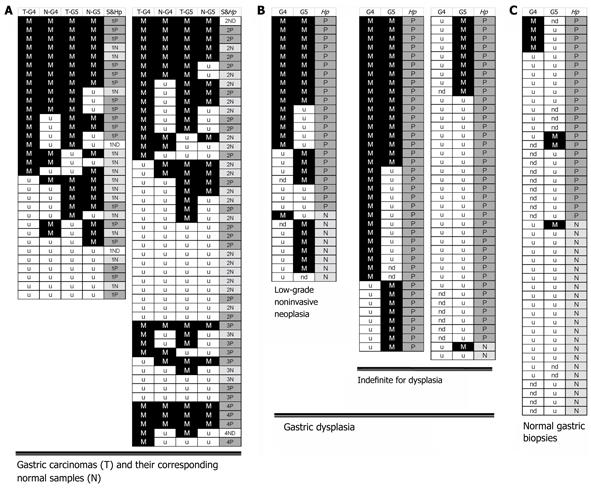
Figure 2 Summary of MSP results of GATA-4 and GATA-5 methylation in SGCs (A), gastric dysplasia (B), and normal gastric mucosa samples (C).
Each row represents a single sample. G4: GATA-4; G5: GATA-5; M in black, detection of methylated alleles; u in white, detection of unmethylated alleles only; ND in white, methylation information not available. T: Sporadic gastric carcinomas (SGC) tissue; N: SGC-paired corresponding normal tissue; S: Clinical stage (1-4) of SGCs; Hp: H. pylori infection positive (P in gray) or negative (N in light gray), detected with the 23S rRNA-PCR for the normal and corresponding normal gastric mucosa samples and with the 13C-urea breath test for subjects with gastric dysplasia. The GATA-4 methylation positive rate in low-grade GIN from patients with H. pylori infection was significantly higher than that from patients without infection (15/21 vs 1/7, P = 0.023). The GATA-5 methylation positive rate in low-grade GIN was significantly higher than that in indefinite for dysplasia (20/29 vs 35/75, P = 0.042). The GATA-4 and GATA-5 methylation rates in normal gastric biopsies were significantly lower than those in gastric dysplasia and SGC and the adjacent normal tissues (P < 0.001).
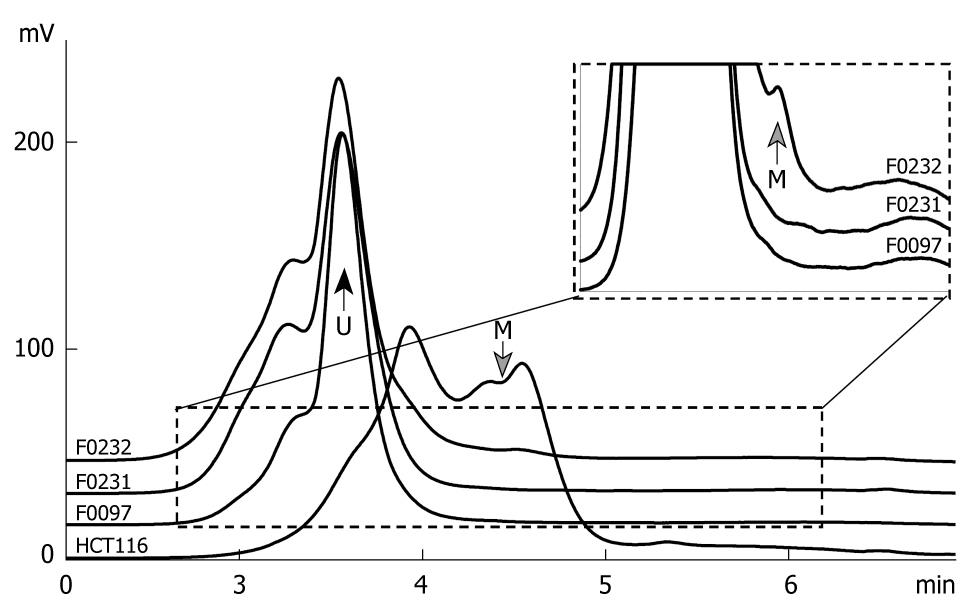
Figure 3 Chromatogram of the methylated and unmethylated GATA-4 CpG islands by denatured high performance liquid chromatography (DHPLC).
The 385-bp PCR product of the methylated and unmethylated GATA-4 were separated by DHPLC at a partial denaturing temperature 57.1°C and detected by a fluorescence (FL)-detector. The proportion of methylated GATA-4 in the tested samples was calculated according to the ratio of the peak area for the methylated GATA-4 to the total peak area for both the methylated and unmethylated GATA-4. The gray arrow points to the peak for the methylated GATA-4 (M) at the retention time 4.5 min; The black arrow points to the peak for the unmethylated GATA-4 (U) at the retention time 3.6 min. Genomic DNA of HCT116 was used as the GATA-4 methylation positive control. The inserted chart represents the dashed line surrounding the area. GATA-4 methylation was detected in the tested sample F0232.
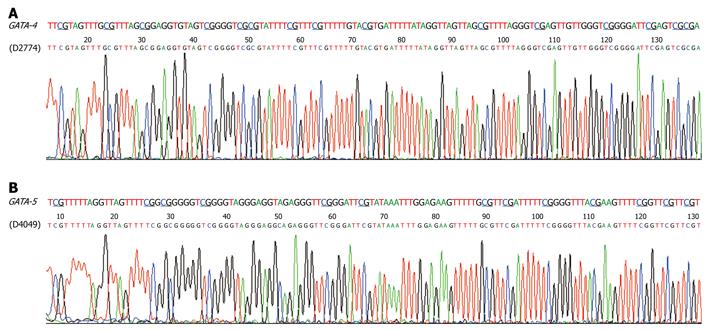
Figure 4 Sequencing of the methylated MSP products for GATA-4 (A) and GATA-5 (B) from two representative gastric dysplasia samples.
The predicted sequence of bisulfite-modified GATA-4 and GATA-5 CpG islands are listed in each panel at the top. The methylated CpG sites are underlined.
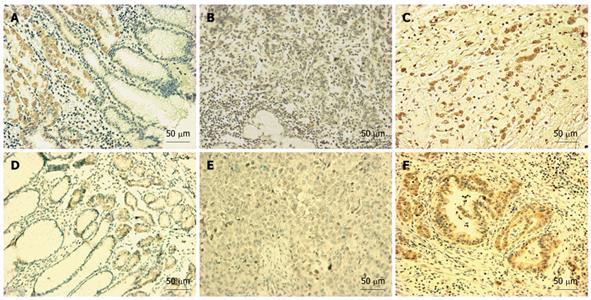
Figure 5 GATA-4 (A-C) or GATA-5 (D-F) protein in various gastric mucosa samples by immunohistochemical staining (IHC).
A and D: GATA-4 and GATA-5 expression were confined to the gland region in the normal gastric mucosa; B and E: Carcinoma cells containing methylated alleles of GATA-4 (G89) or GATA-5 (G48) exhibited negative staining; C and F: Unmethylated cancer cells exhibited positive staining in case G27 and G45, respectively. Diaminobenzidine was used as a chromogen, followed by counterstaining with hematoxylin. Black bar, 50 μm in length.
-
Citation: Wen XZ, Akiyama Y, Pan KF, Liu ZJ, Lu ZM, Zhou J, Gu LK, Dong CX, Zhu BD, Ji JF, You WC, Deng DJ. Methylation of
GATA-4 andGATA-5 and development of sporadic gastric carcinomas. World J Gastroenterol 2010; 16(10): 1201-1208 - URL: https://www.wjgnet.com/1007-9327/full/v16/i10/1201.htm
- DOI: https://dx.doi.org/10.3748/wjg.v16.i10.1201


