Copyright
©2010 Baishideng.
World J Gastroenterol. Jan 7, 2010; 16(1): 89-97
Published online Jan 7, 2010. doi: 10.3748/wjg.v16.i1.89
Published online Jan 7, 2010. doi: 10.3748/wjg.v16.i1.89
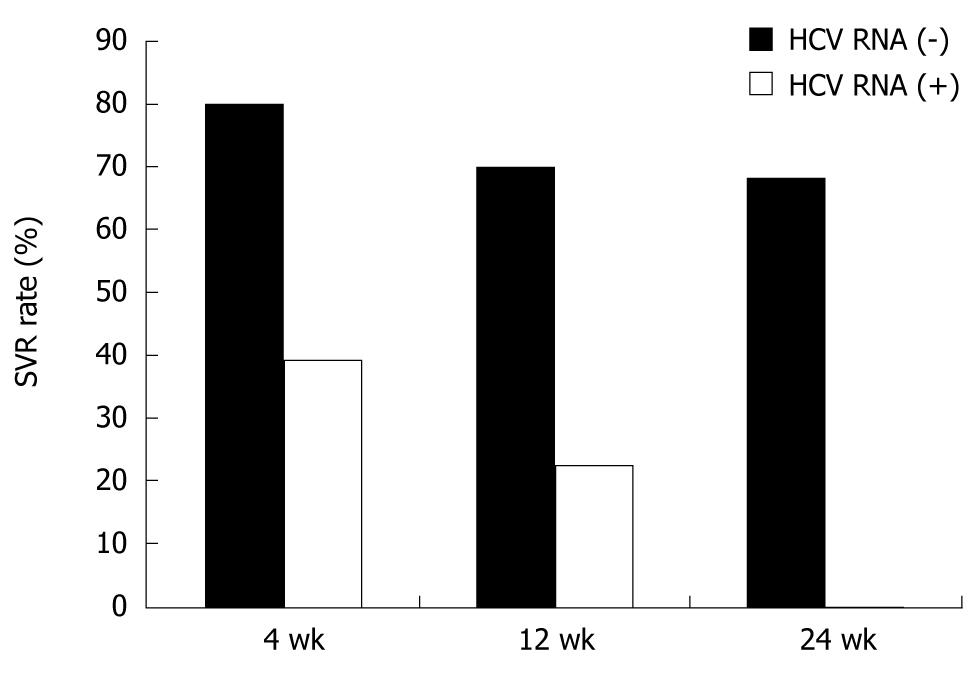
Figure 1 Sustained virological response rates (%) of the patients during peg-interferon plus ribavirin therapy for chronic hepatitis C at week 4 (4 wk), week 12 (12 wk) and week 24 (24 wk).
HCV RNA (-) means patients whose serum HCV RNA became undetectable at the time point indicated. HCV RNA (+) means patients whose serum HCV RNA was not cleared at the indicated time point.
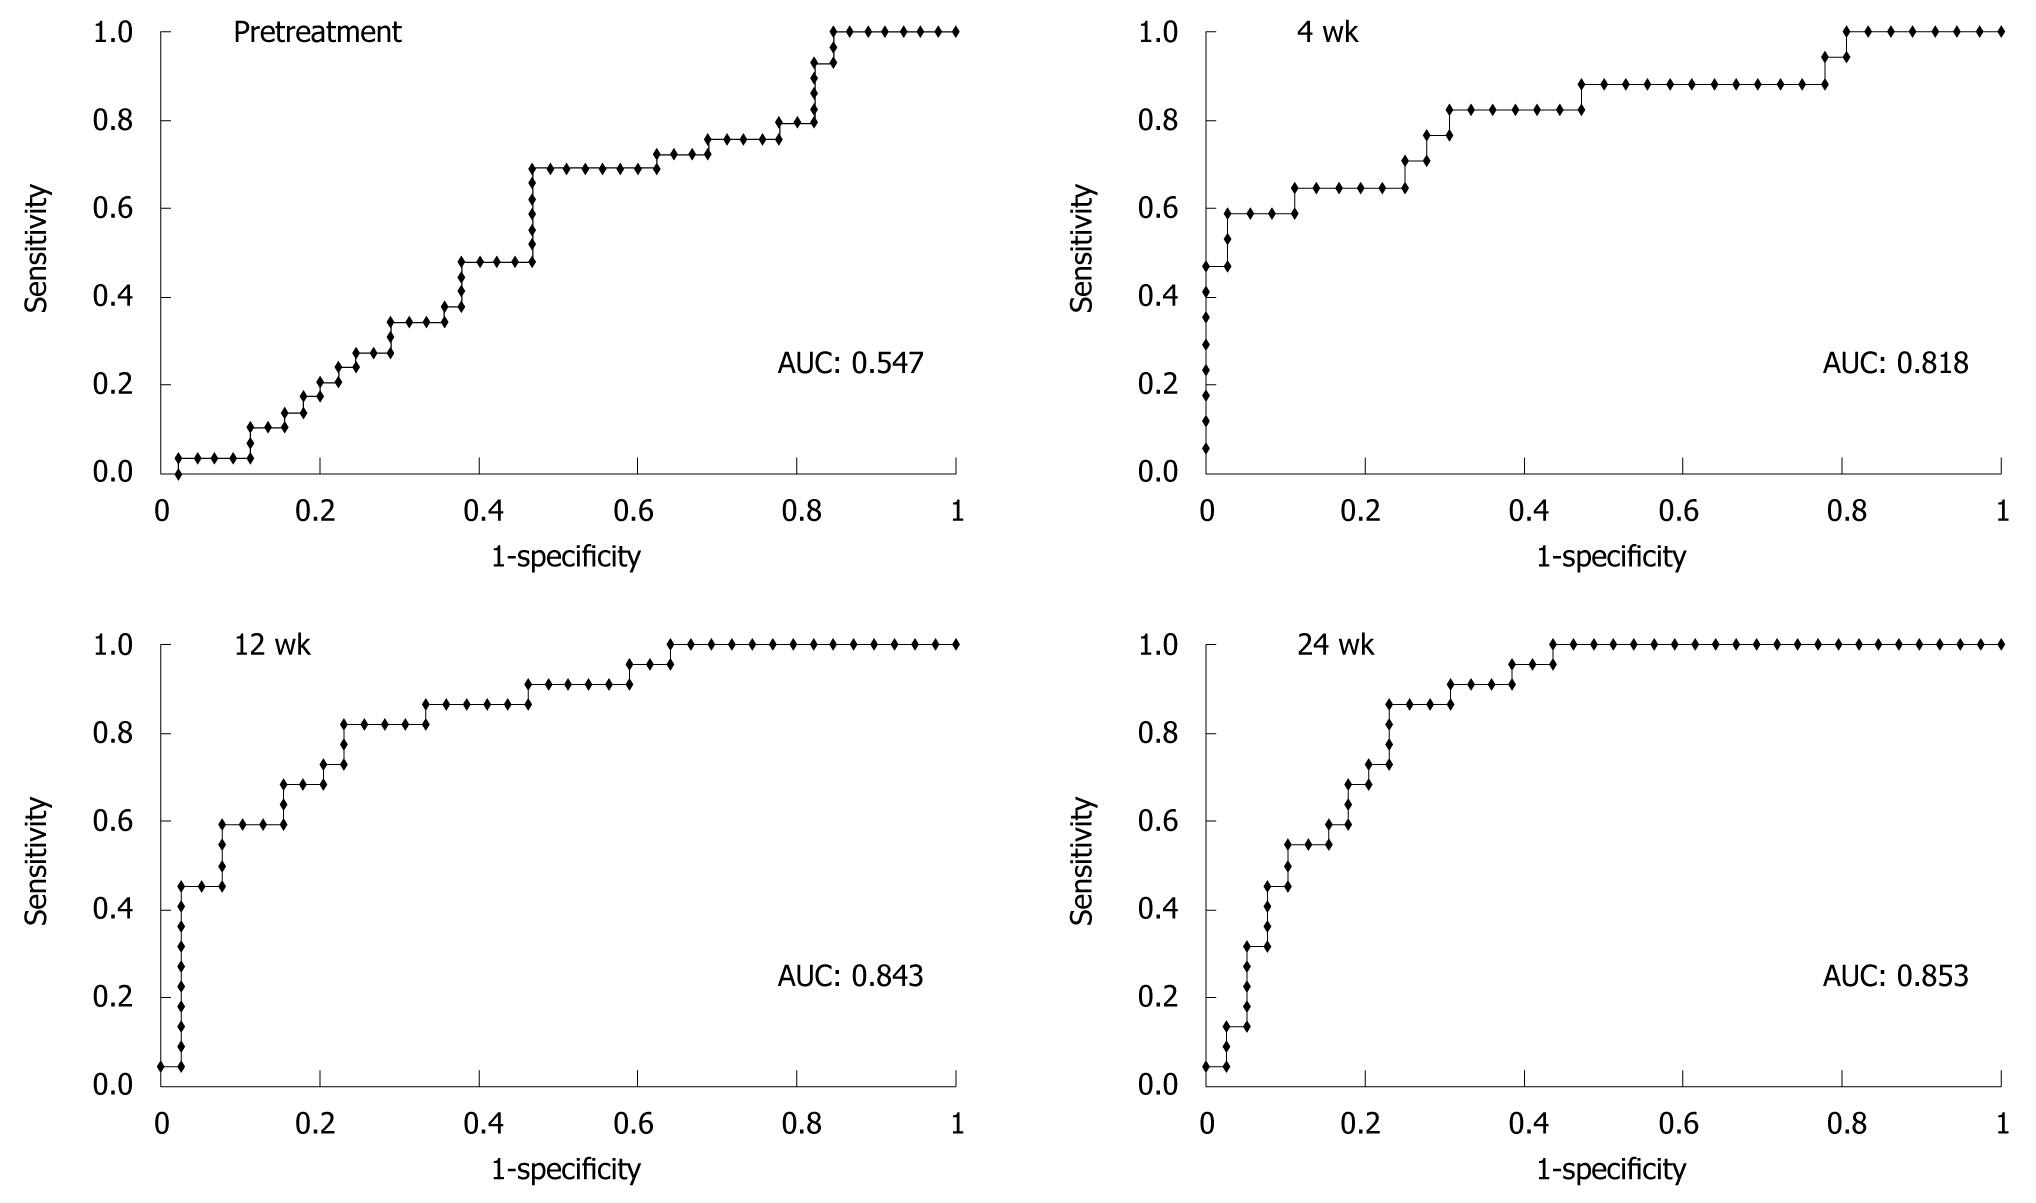
Figure 2 Receiver operating characteristic (ROC) curves and the area under curve (AUC) of the predictive values made by the formulae during peg-interferon plus ribavirin therapy for chronic hepatitis C at week 4, 8, 12 and 24.
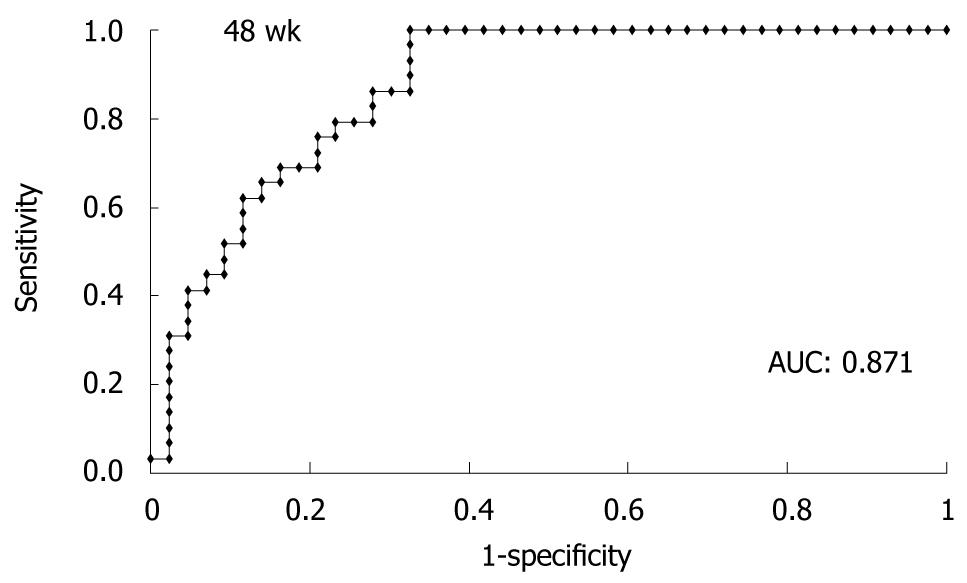
Figure 3 Receiver operating characteristic (ROC) curves of the predictive values calculated by the formula from data up to 48 wk of peg-interferon plus ribavirin therapy for chronic hepatitis C.
- Citation: Saito H, Ebinuma H, Ojiro K, Wakabayashi K, Inoue M, Tada S, Hibi T. On-treatment predictions of success in peg-interferon/ribavirin treatment using a novel formula. World J Gastroenterol 2010; 16(1): 89-97
- URL: https://www.wjgnet.com/1007-9327/full/v16/i1/89.htm
- DOI: https://dx.doi.org/10.3748/wjg.v16.i1.89


