Copyright
©2009 The WJG Press and Baishideng.
World J Gastroenterol. Oct 21, 2009; 15(39): 4896-4906
Published online Oct 21, 2009. doi: 10.3748/wjg.15.4896
Published online Oct 21, 2009. doi: 10.3748/wjg.15.4896
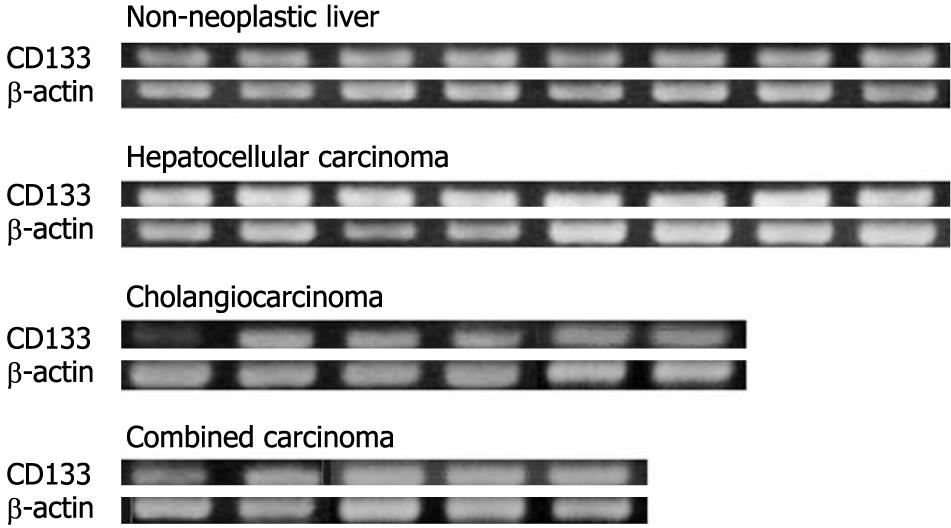
Figure 1 Expression of CD133 mRNA.
Nested RT-PCR revealed CD133 mRNA expression in all cases of non-neoplastic liver tissue, HCC, intrahepatic cholangiocarcinoma, and combined hepatocellular and cholangiocarcinoma. Only eight cases of HCC are shown, although the remaining cases also expressed CD133 mRNA.
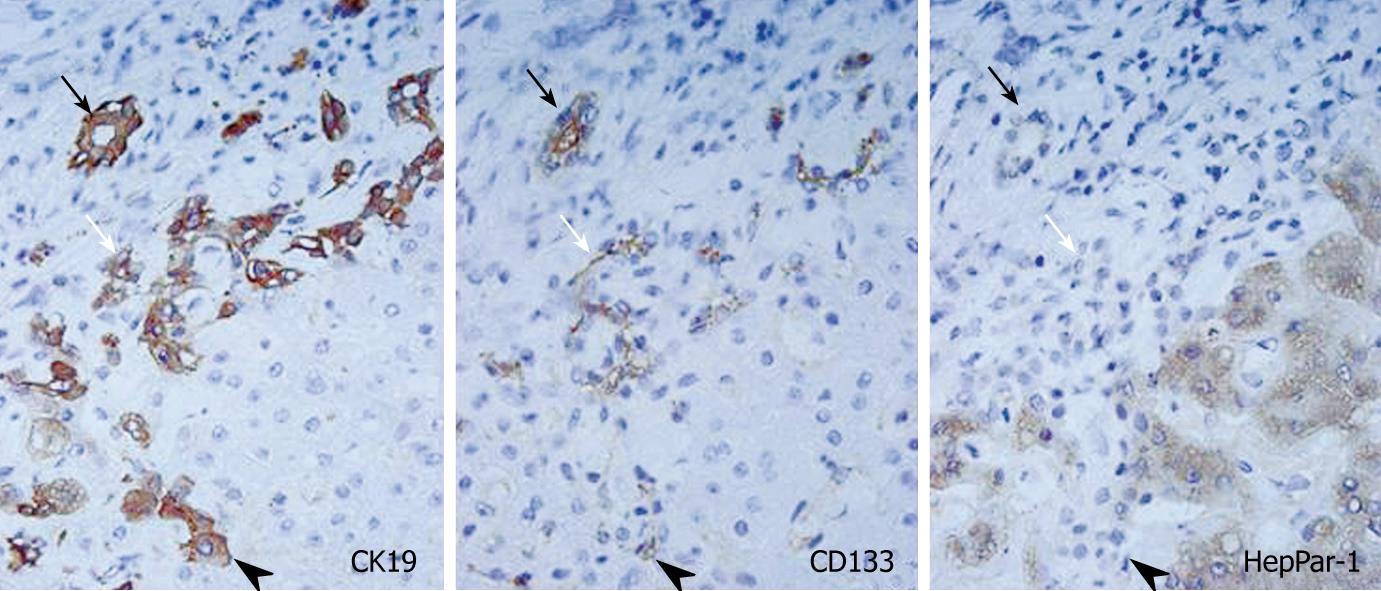
Figure 2 CD133 expression in liver cirrhosis (immunostaining).
CD133 was expressed in bile duct (black arrows), bile ductules (white arrows), and small parenchymal cells surrounded by hepatocytes. CD133 was expressed on the cellular membrane with an accentuation on the luminal side. CD133+ cells were also positive for CK19 but not HepPar-1. All images, × 400.
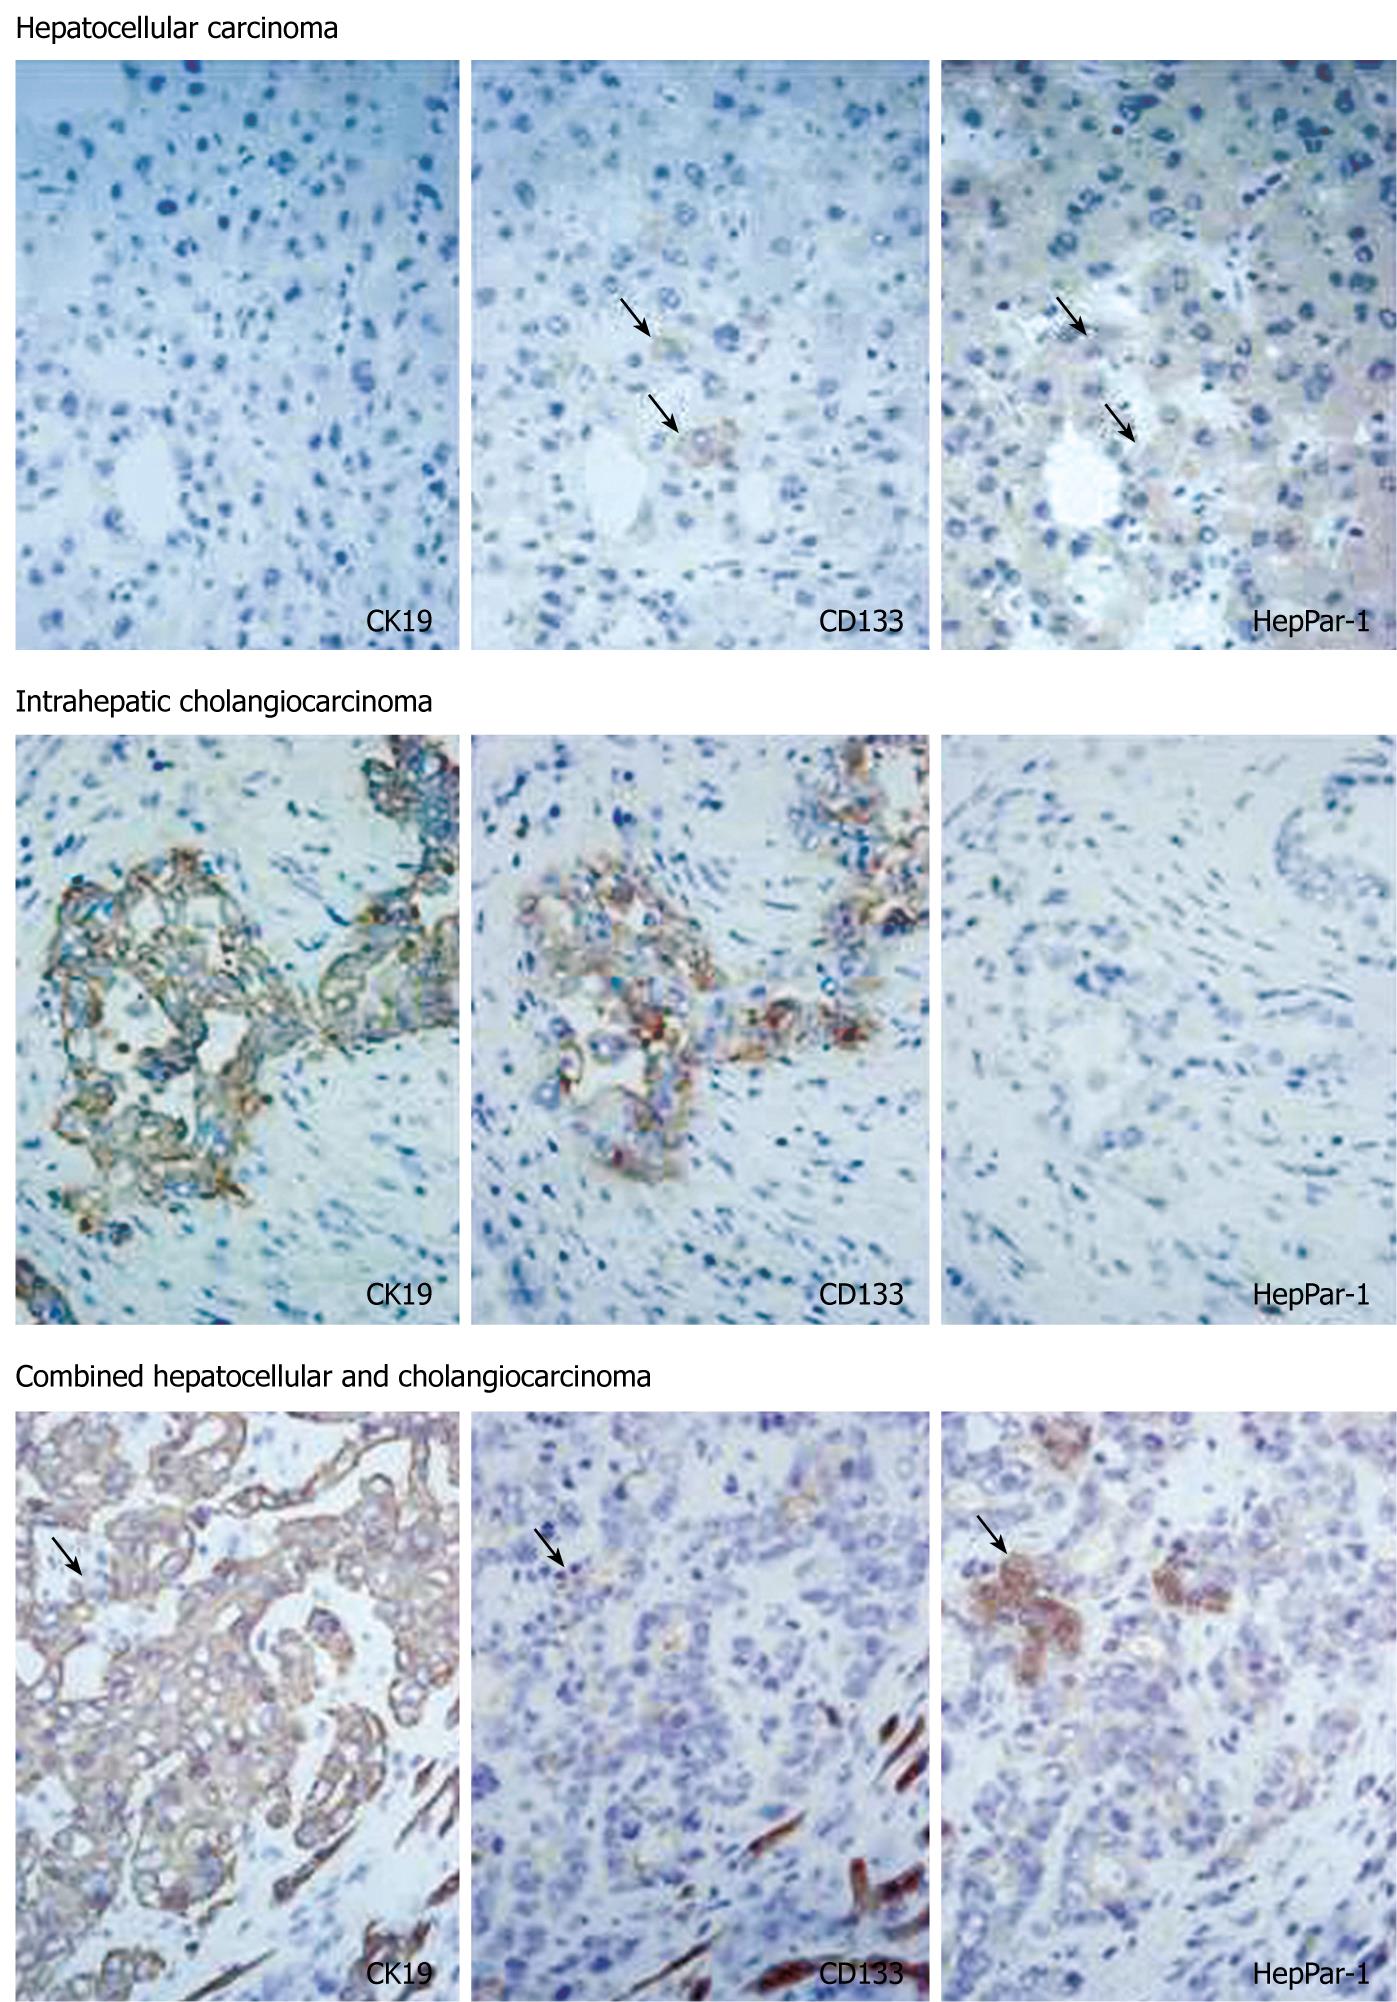
Figure 3 CD133 expression in HCC, intrahepatic cholangiocarcinoma, and combined hepatocellular and cholangiocarcinoma (immunostaining).
In HCC, a few carcinoma cells expressed CD133, and those cells were CK19- and HepPar-1+ (arrows). In cholangiocarcinoma, CD133 was expressed diffusely in carcinoma cells, and CK19 was also positive. In combined carcinoma, CD133 was expressed mainly in carcinoma cells positive for CK19, whereas some carcinoma cells were CD133+/CK19-/HepPar-1+ (arrows). All images, × 400.
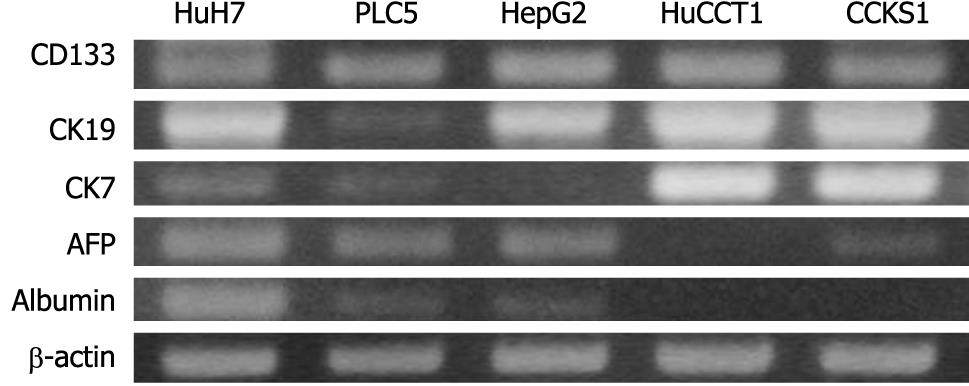
Figure 4 Expression levels of mRNA in cell lines.
CD133 mRNA was expressed in all cell lines examined. Biliary markers (CK19 and CK7) were expressed more often in cholangiocarcinoma cell lines (HuCCT1 and CCKS1), whereas hepatocellular markers (AFP and albumin) were expressed constantly in HCC cell lines (HuH7, PLC5, and HepG2).
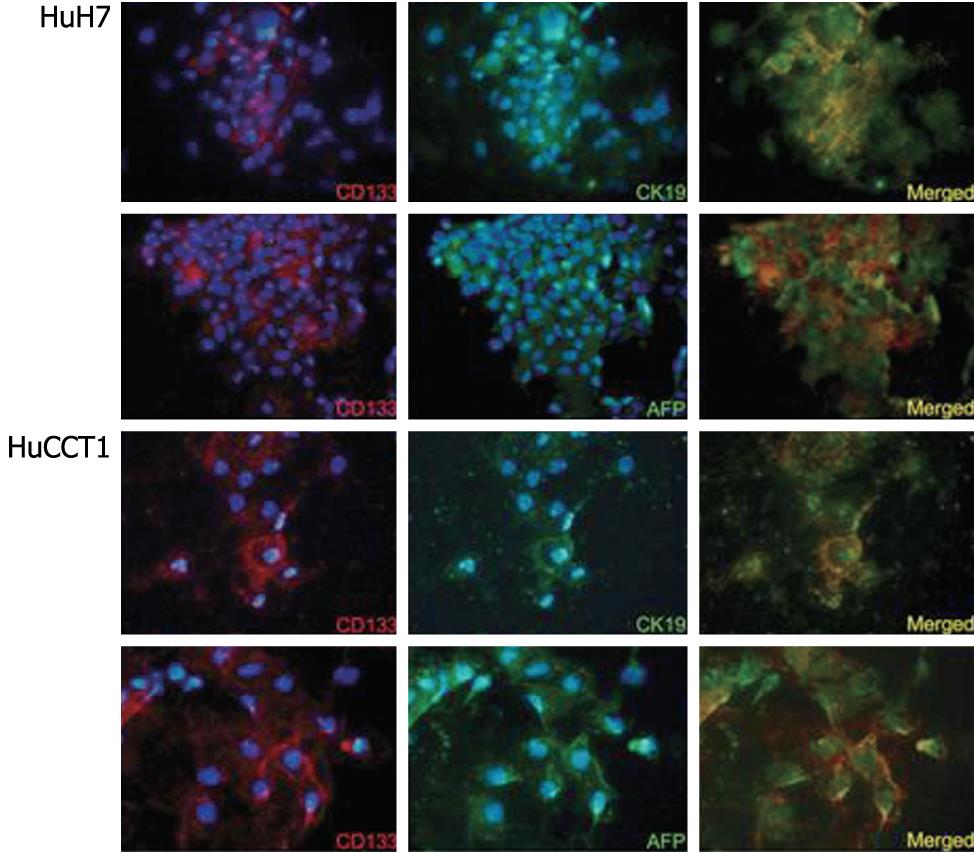
Figure 5 Dual immunofluorescence of CD133/CK19 and CD133/AFP in HuH7 and HuCCT1 cells.
CD133+ carcinoma cells were positive for CK19 or AFP in both HuH7 and HuCCT1 cell lines. All images, × 400.
Figure 6 Flow cytometry analysis of CD133 in HuH7 and HuCCT1 cells.
CD133+ cells comprised 65.0% of HuH7 and 48.5% of HuCCT1 cells. CD133+ and CD133- cells could be generated from CD133+ and CD133- subpopulations of HuH7 and HuCCT1 cells after 4 wk subculture.
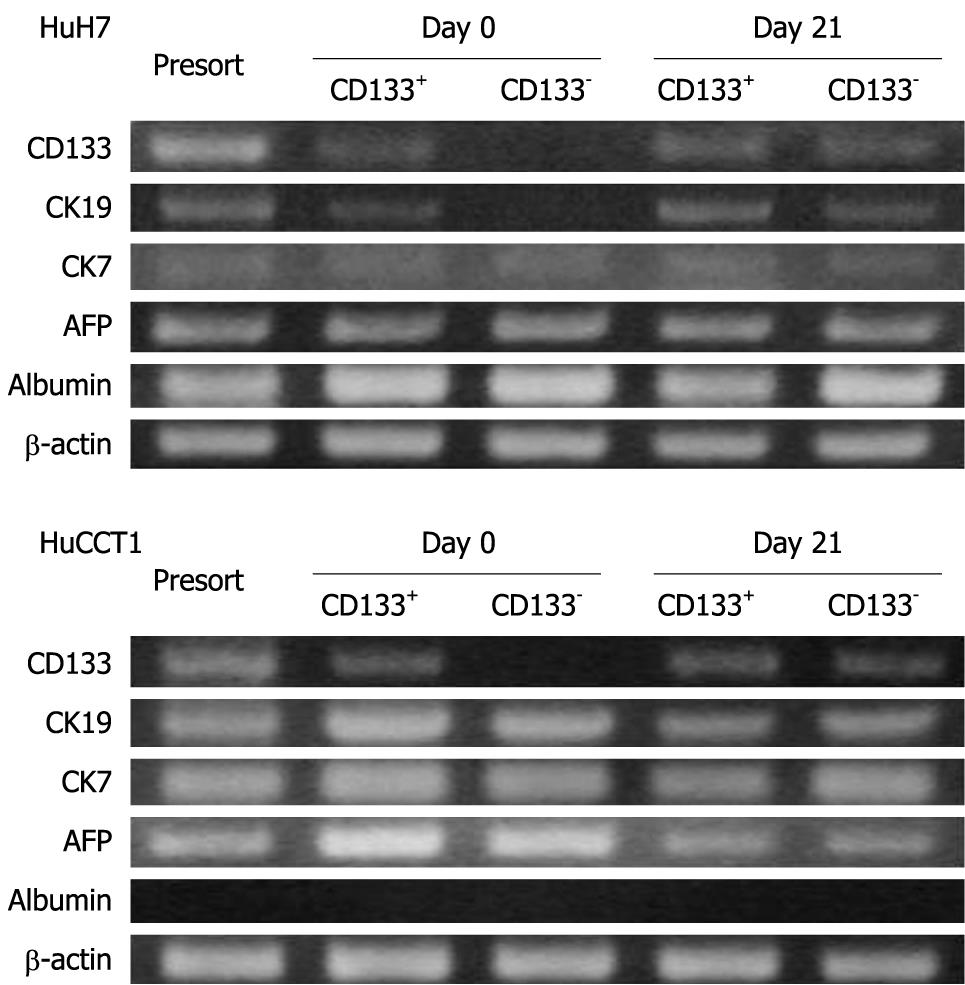
Figure 7 Expression CD133, CK19, CK7, AFP and albumin in HuH7 and HuCCT1 cells before sorting, just after sorting (day 0), and after 3 wk subculture (day 21).
At day 0, expression of CD133 mRNA was observed in only the CD133+ population in HuH7 and HuCCT1 cells. However, CD133+ and CD133- populations expressed similar levels of CD133 mRNA at day 21. At day 21, CD133+ and CD133-HuH7 and HuCCT1 cells showed almost similar mRNA expression patterns.
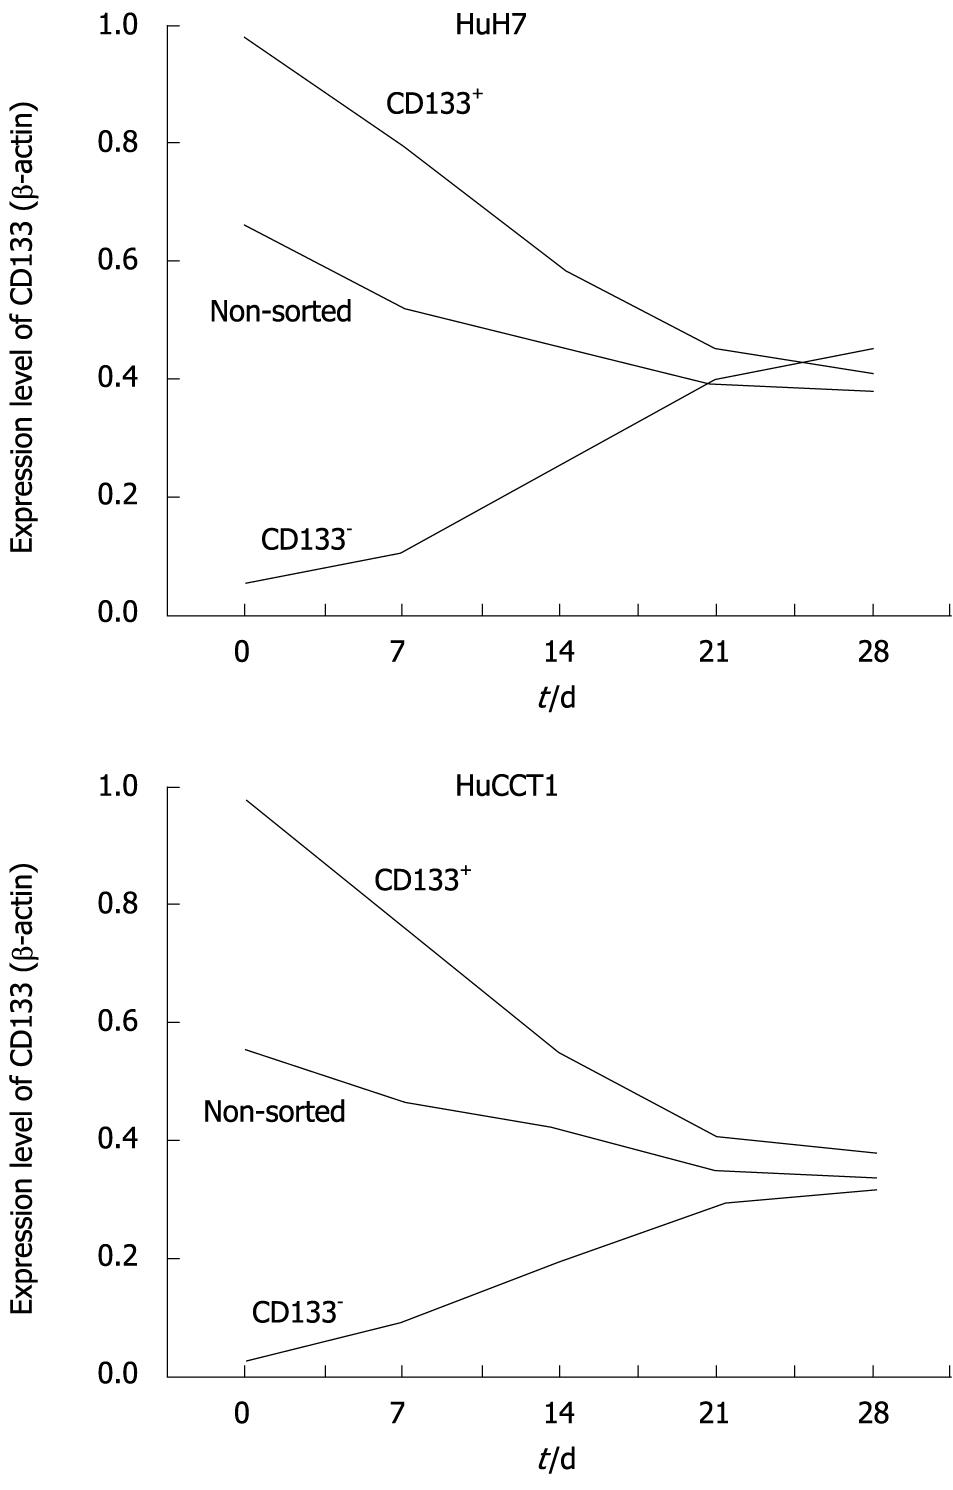
Figure 8 Time-dependent alteration of CD133 expression in HuH7 and HuCCT1 cells.
Real-time quantitative RT-PCR revealed CD133 expression levels gradually decreased in non-sorted cells after passage. CD133+ HuH7 and HuCCT1 cells showed decreased expression of CD133. In contrast, CD133 expression increased in CD133- cells in both cell lines. Around day 21-28, CD133 expression in three types of cells became similar to the level in both cell lines.
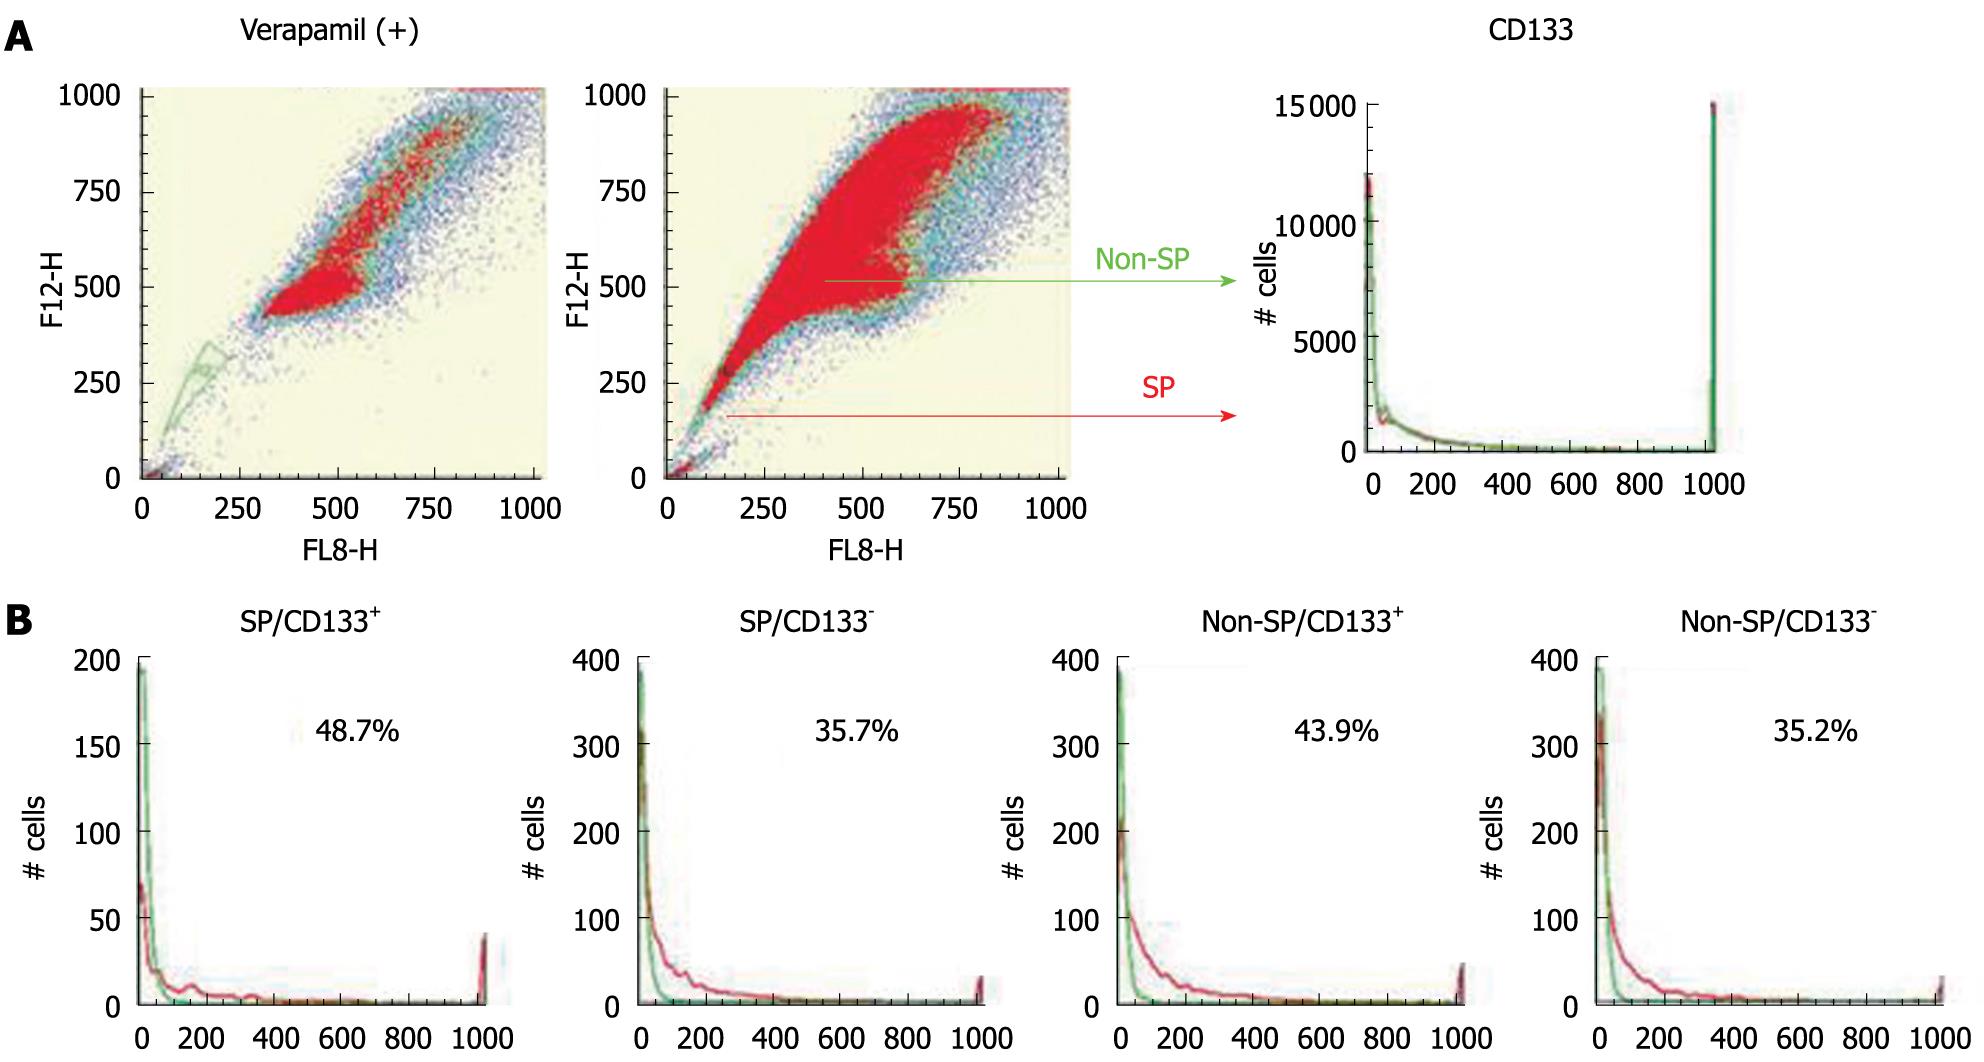
Figure 9 Relationship between CD133+ cells and SP phenotype.
A: The percentages of CD133+ cells in SP and non-SP fractions of HuH7 cells were examined using Hoechst 33342 and a PE-conjugated antibody to CD133. The ratio of CD133+ cells was almost the same in the SP and non-SP fractions; B: HuH7 cells were sorted into four populations: SP/CD133+, SP/CD133-, non-SP/CD133+, and non-SP/CD133-. After 4 wk subculture, CD133+ and CD133- cells were generated at similar levels from all populations.
- Citation: Yoshikawa S, Zen Y, Fujii T, Sato Y, Ohta T, Aoyagi Y, Nakanuma Y. Characterization of CD133+ parenchymal cells in the liver: Histology and culture. World J Gastroenterol 2009; 15(39): 4896-4906
- URL: https://www.wjgnet.com/1007-9327/full/v15/i39/4896.htm
- DOI: https://dx.doi.org/10.3748/wjg.15.4896


