Copyright
©2009 The WJG Press and Baishideng.
World J Gastroenterol. Sep 7, 2009; 15(33): 4177-4182
Published online Sep 7, 2009. doi: 10.3748/wjg.15.4177
Published online Sep 7, 2009. doi: 10.3748/wjg.15.4177
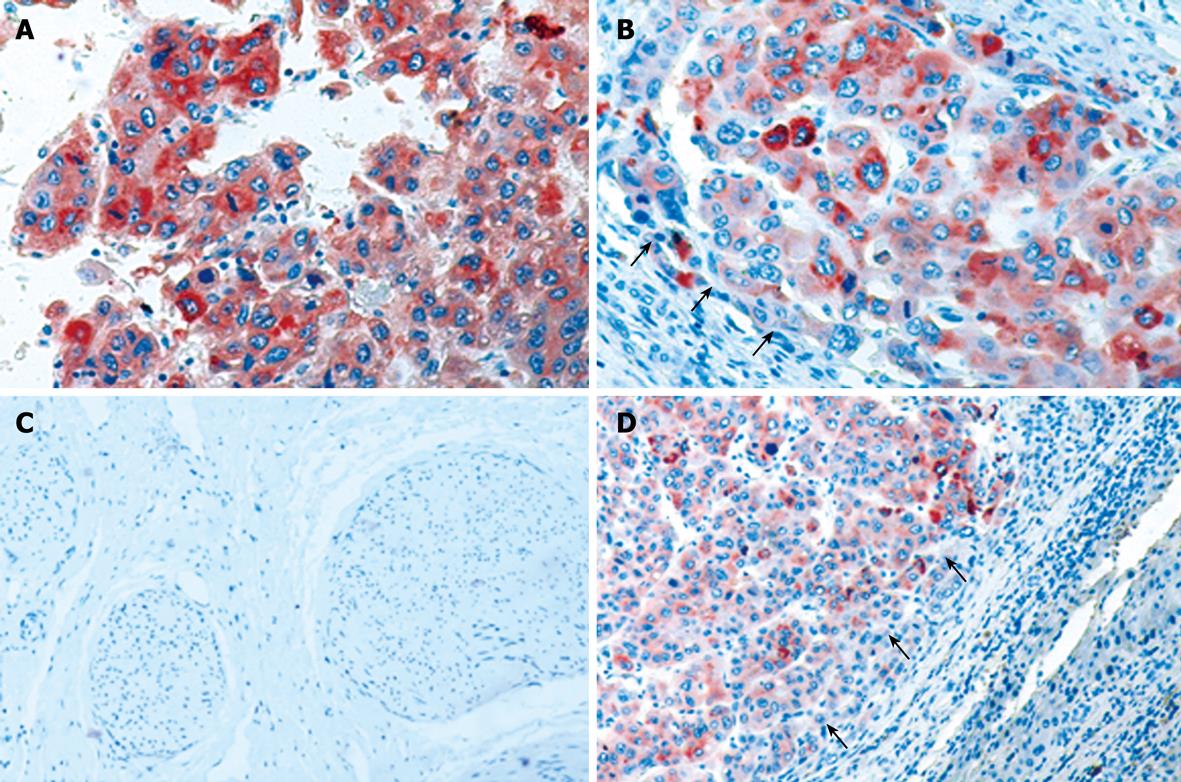
Figure 1 Expression of PLK1 in HCC tissue specimens.
A: Expression of PLK1 in HCC tissue, especially in cytoplasm; B, D: Tumor tissue margins seen under the microscope (black arrows); C: Liver regenerating nodule sample; D: Adjacent normal tissue examined for PLK1 expression. Original magnifications, A and B × 200; C and D × 100.
Figure 2 Expression of PLK mRNA in HCC, adjacent normal and regenerating nodule tissues.
Lanes 1 and 2, HCC tissues; Lanes 3 and 4, adjacent normal tissue; Lanes 5 and 6, regenerating nodule tissues. RT-PCR for β-actin was used to monitor the quality of the RNA sample. RT-PCR was performed in triplicate.
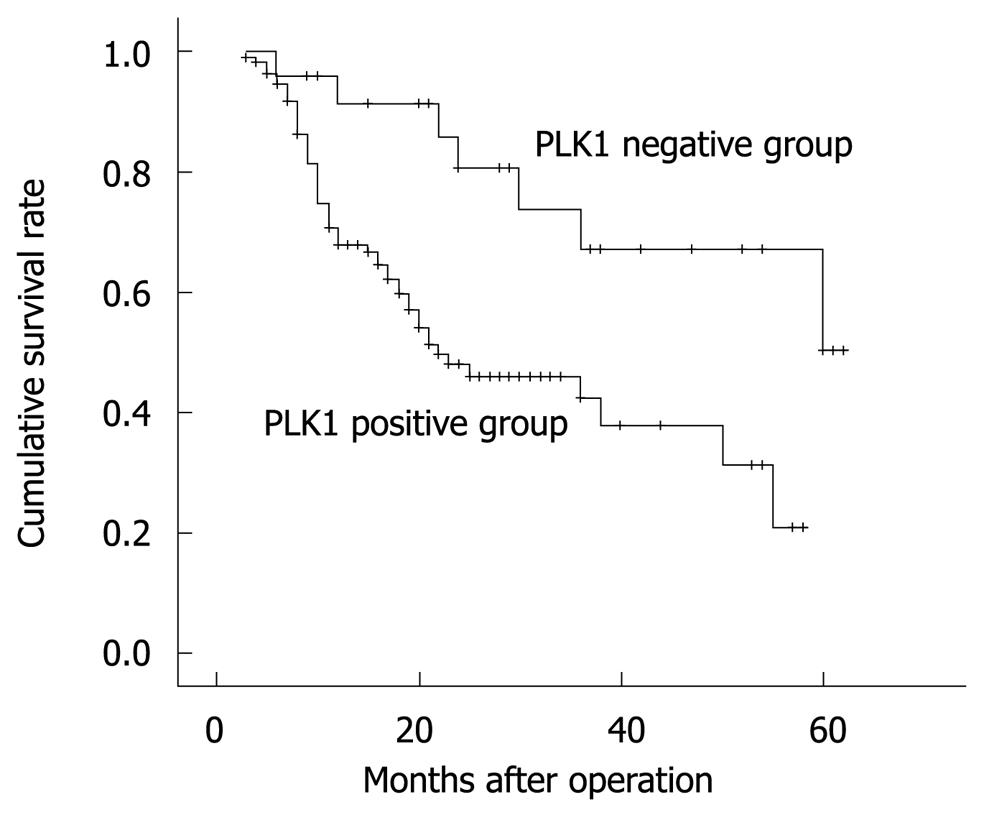
Figure 3 Log-rank test shows that HCC patients in the positive PLK1 mRNA expression group had a lower survival than those in the negative group.
- Citation: He ZL, Zheng H, Lin H, Miao XY, Zhong DW. Overexpression of polo-like kinase1 predicts a poor prognosis in hepatocellular carcinoma patients. World J Gastroenterol 2009; 15(33): 4177-4182
- URL: https://www.wjgnet.com/1007-9327/full/v15/i33/4177.htm
- DOI: https://dx.doi.org/10.3748/wjg.15.4177


