Copyright
©2009 The WJG Press and Baishideng.
World J Gastroenterol. Sep 7, 2009; 15(33): 4143-4149
Published online Sep 7, 2009. doi: 10.3748/wjg.15.4143
Published online Sep 7, 2009. doi: 10.3748/wjg.15.4143
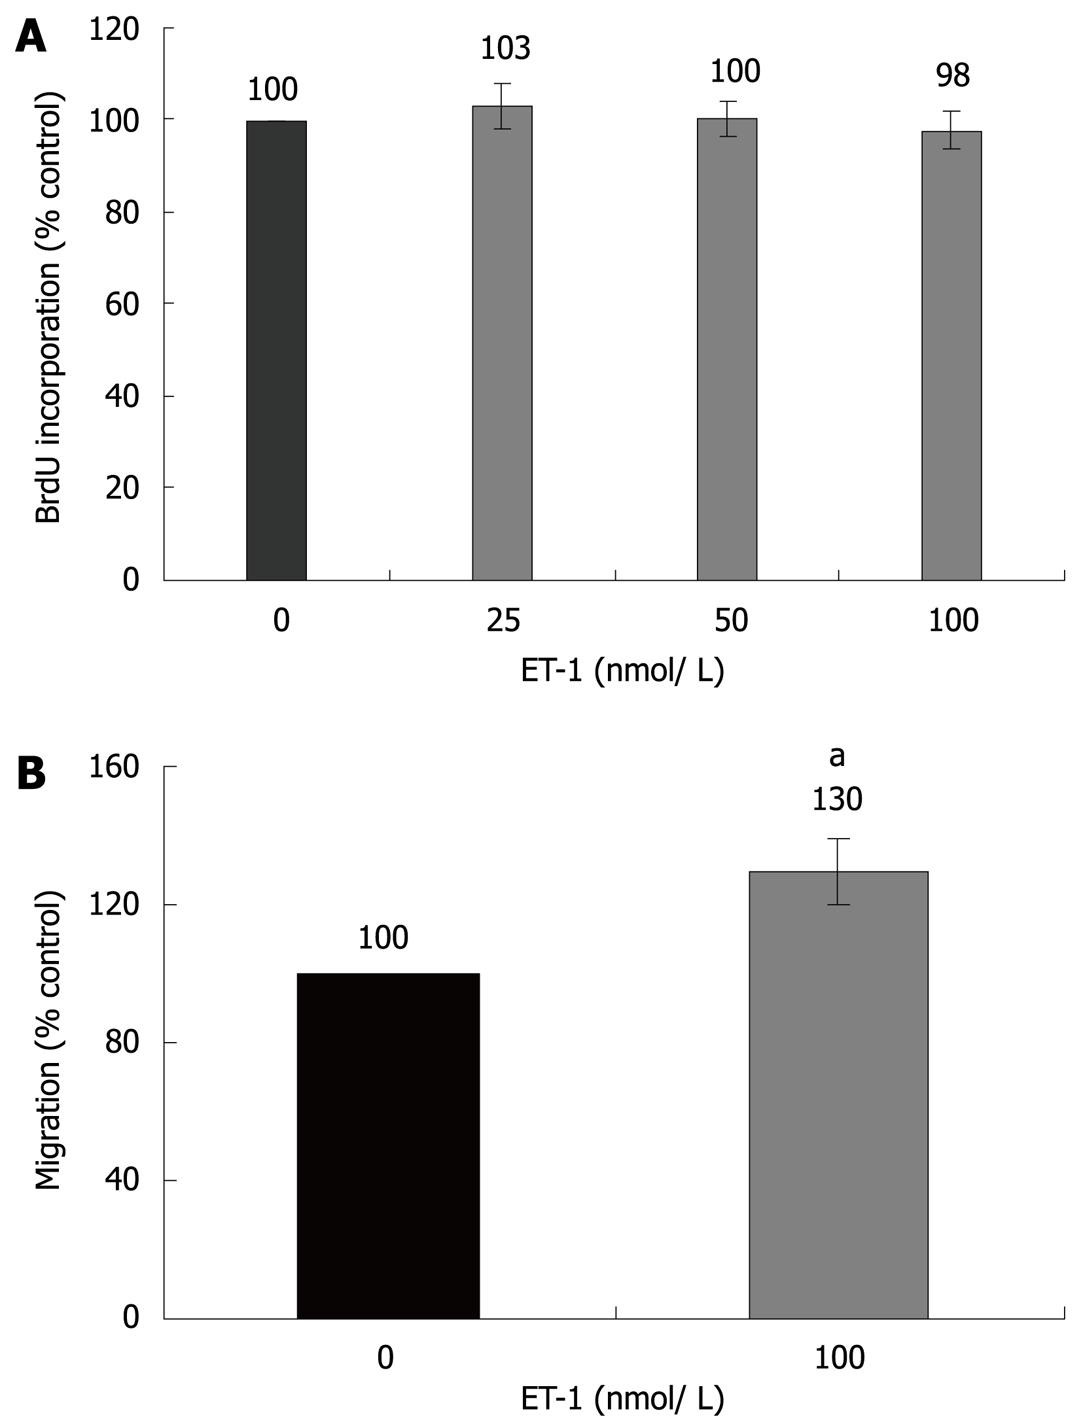
Figure 1 Effects of ET-1 on PSC proliferation and migration.
A: PSCs growing in 96-well plates were treated, under FCS-free conditions, with ET-1 at the indicated concentrations for 24 h. Cell proliferation was assessed with the BrdU DNA-incorporation assay. One hundred percent BrdU incorporation corresponds to untreated PSCs; B: CFSE-labelled cells were seeded into the upper chamber of 24-transwell plates, whereas ET-1 (100 nmol/L) was added to the lower chamber as indicated. Cell migration under FCS-free conditions was analyzed as described in the “Materials and Methods” section. One hundred percent cell migration corresponds to the intensity of the fluorescence signal received from untreated PSCs. Data in (A) and (B) are presented as mean ± SE (n≥ 6 separate cultures); aP < 0.05 vs control cultures.
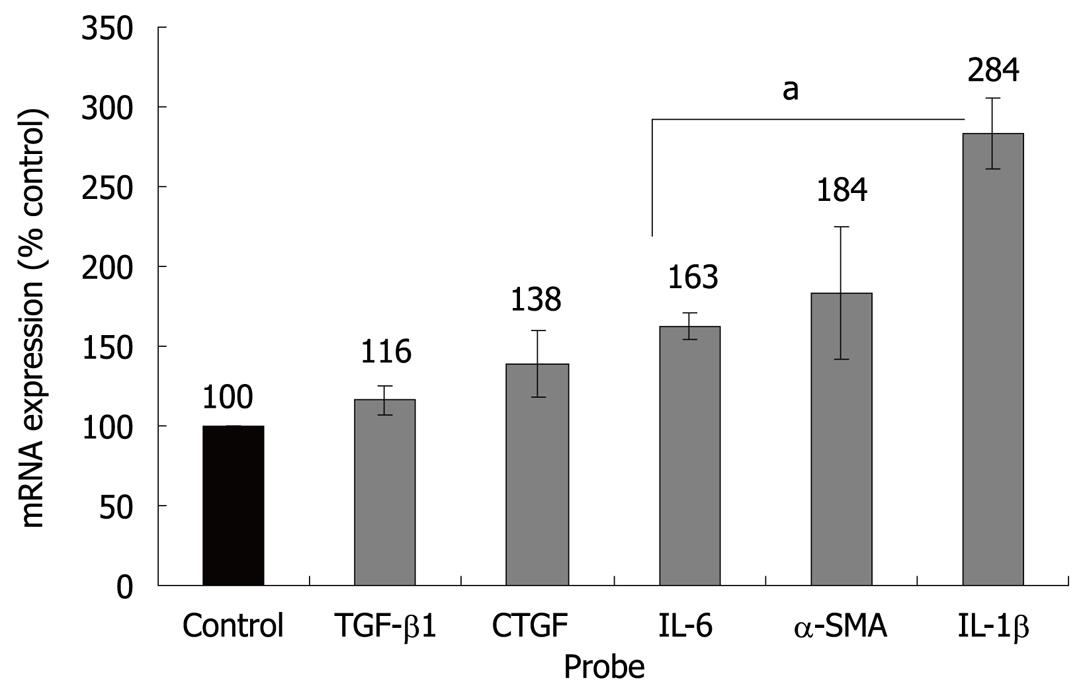
Figure 2 Effects of ET-1 on PSC gene expression.
PSC growing in 6-well plates were starved of serum for 1 h before they were stimulated with ET-1 (100 nmol/L) as indicated. The mRNA expression of TGF-β1, CTGF, IL-6, α-SMA, IL-1β and the housekeeping gene HPRT was analyzed by real time PCR, and relative amounts of target mRNA were calculated. One hundred percent mRNA expression of each gene corresponds to untreated PSC. Data of 6 independent experiments (with triplicate samples) were used to calculate mean ± SE; aP < 0.05 vs control cultures.
Figure 3 ET-1 induces phosphorylation of ERK1/2 and p38.
PSC were starved of serum for 16 h before they were stimulated with ET-1 (100 nmol/L) for the indicated periods of time (A, D). ERK1/2 and p38 phosphorylation were analyzed by immunoblotting (B, E). Reprobing of the blots with anti-ERK1/2 and anti-p38 protein-specific antibodies revealed no systematic differences in the ERK1/2 and p38 amount among the samples (C, F). Fluorescence signal intensities of phospho (p)-ERK1/2, ERK1/2 protein, phospho (p)-p38 and p38 protein were quantified using Odyssey® software version 3.0. Subsequently, the ratios of phospho-ERK/ERK protein (C) and phospho-p38/p38 (F) protein were calculated. A ratio of one hundred percent corresponds to unstimulated control cultures. The data shown are representative of three independent experiments.
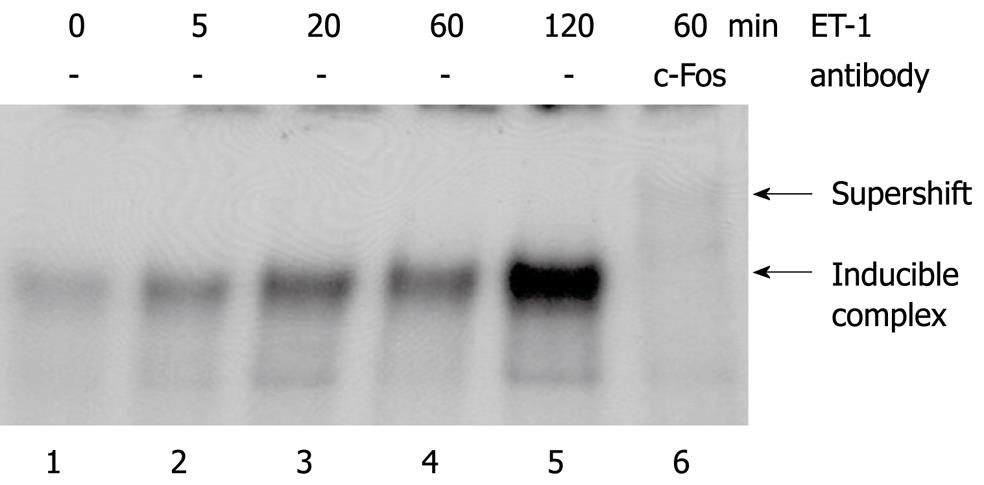
Figure 4 ET-1 activates DNA binding of AP-1.
Serum-starved PSC growing in 6-well plates were incubated with ET-1 (100 nmol/L) for the indicated periods of time. Nuclear extracts were subjected to EMSA analysis using a [32P]-labelled oligonucleotide with an AP-1 binding motif. Supershift analysis was performed by incubating the binding reaction with a c-Fos-specific antibody. Shifted complex and supershifted band (lane 6, faint since antibody binding may diminish binding of c-Fos to the oligonucleotide) are pointed out by arrows. Results are representative of three independent experiments.
Figure 5 Regulation of ET-1 expression in PSC.
PSC growing in 24-well plates were treated with PDGF (10 μg/L), IFN-γ (100 μg/L), CTGF (2 mg/L), TNF-α (10 μg/L), and TGF β1 (5 μg/L) for 48 h as indicated. Afterwards, supernatants were collected and subjected to EIA analysis of the ET-1 content. Data from six separate cultures were used to calculate mean ± SE; aP < 0.05 vs control cultures.
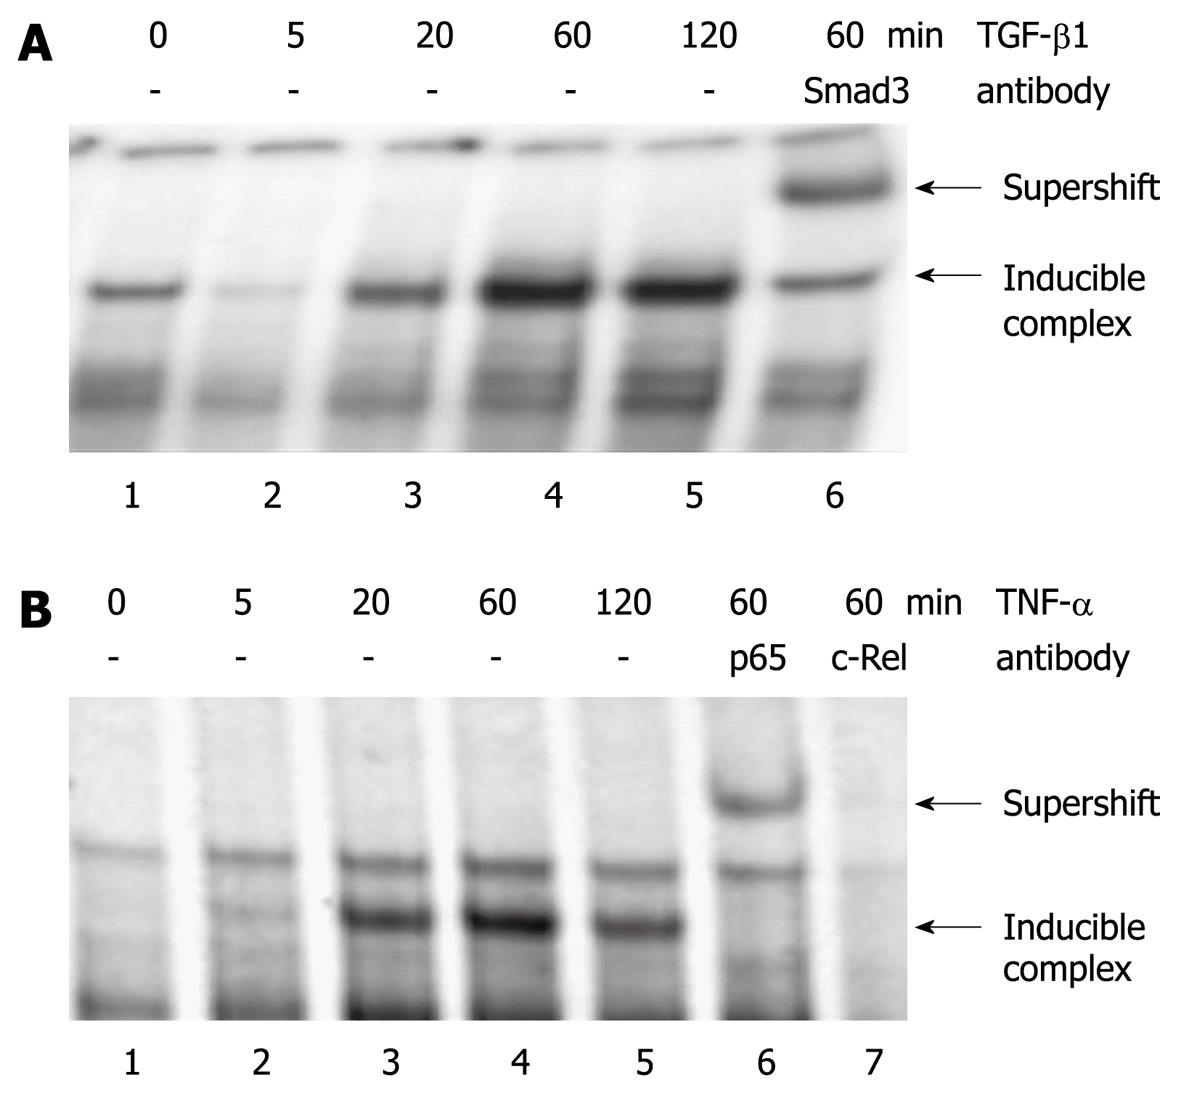
Figure 6 Effects of TGF-β1 and TNF-α on protein binding to the ET-1 promoter.
Serum-starved PSC growing in 6-well plates were incubated with (A) TGF-β1 (5 μg/L) and (B) TNF-α (10 μg/L) for the indicated periods of time. Nuclear extracts were subjected to EMSA analysis using [32P]-labelled oligonucleotides derived from the ET-1 promoter as described in the “Materials and Methods” section. Supershift analysis was performed by incubating binding reactions with the indicated protein-specific antibodies. Inducible complexes and supershifted bands (lane 6 in A and B) are pointed out by arrows. Addition of c-Rel antibody (B, lane 7) weakened protein binding to the oligonucleotide, suggesting the presence of the c-Rel protein in the complex (competitive binding of antibody and oligonucleotide to c-Rel). Results in (A) and (B) are representative of three independent experiments.
- Citation: Jonitz A, Fitzner B, Jaster R. Molecular determinants of the profibrogenic effects of endothelin-1 in pancreatic stellate cells. World J Gastroenterol 2009; 15(33): 4143-4149
- URL: https://www.wjgnet.com/1007-9327/full/v15/i33/4143.htm
- DOI: https://dx.doi.org/10.3748/wjg.15.4143


