Copyright
©2009 The WJG Press and Baishideng.
World J Gastroenterol. Sep 7, 2009; 15(33): 4111-4115
Published online Sep 7, 2009. doi: 10.3748/wjg.15.4111
Published online Sep 7, 2009. doi: 10.3748/wjg.15.4111
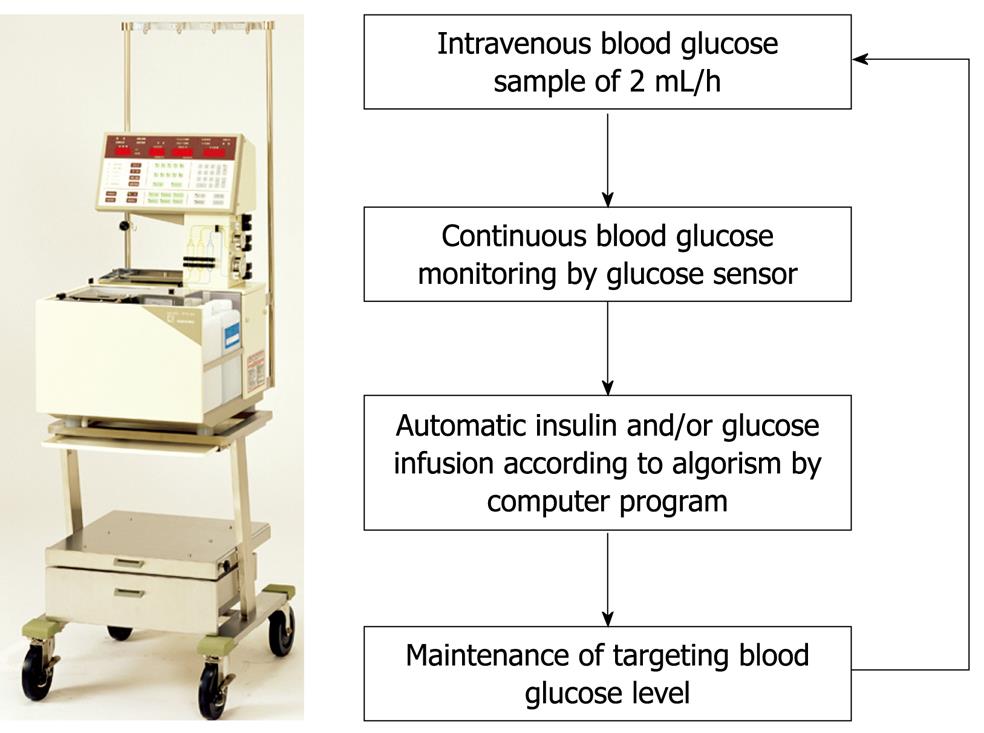
Figure 2 STG-22, a bedside-type artificial endocrine pancreas system with closed-loop.
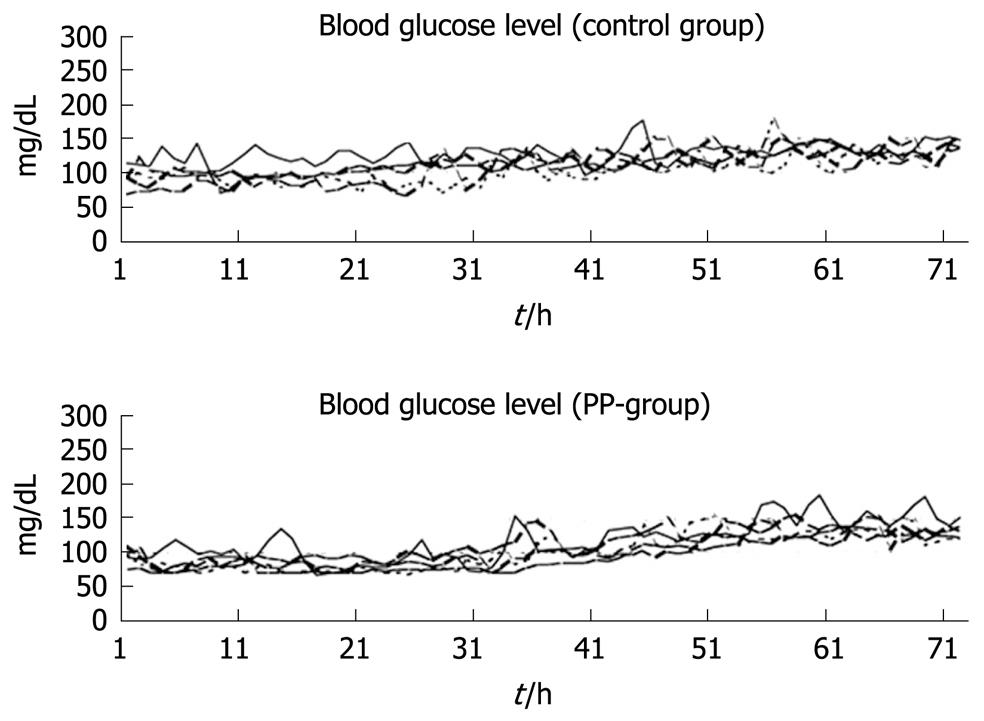
Figure 3 Continuous blood glucose levels over 72 h in 10 dogs after total pancreatectomy[22].
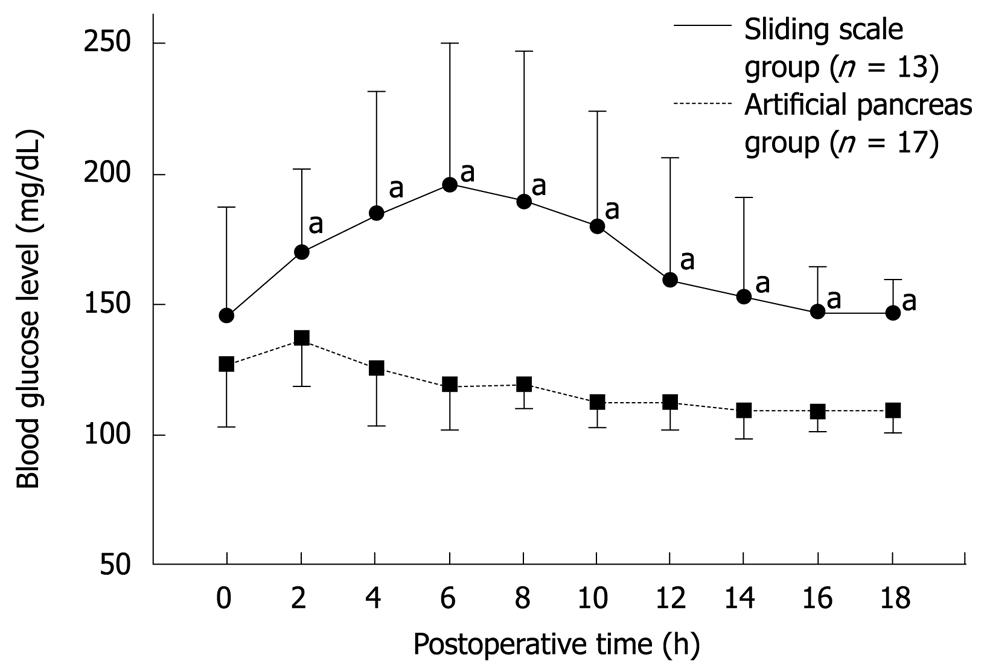
Figure 4 Postoperative blood glucose levels in the sliding scale (n = 13) and artificial pancreas (n = 17) groups during the first 18 h following pancreatectomy[38].
Significant statistical difference (aP < 0.05).
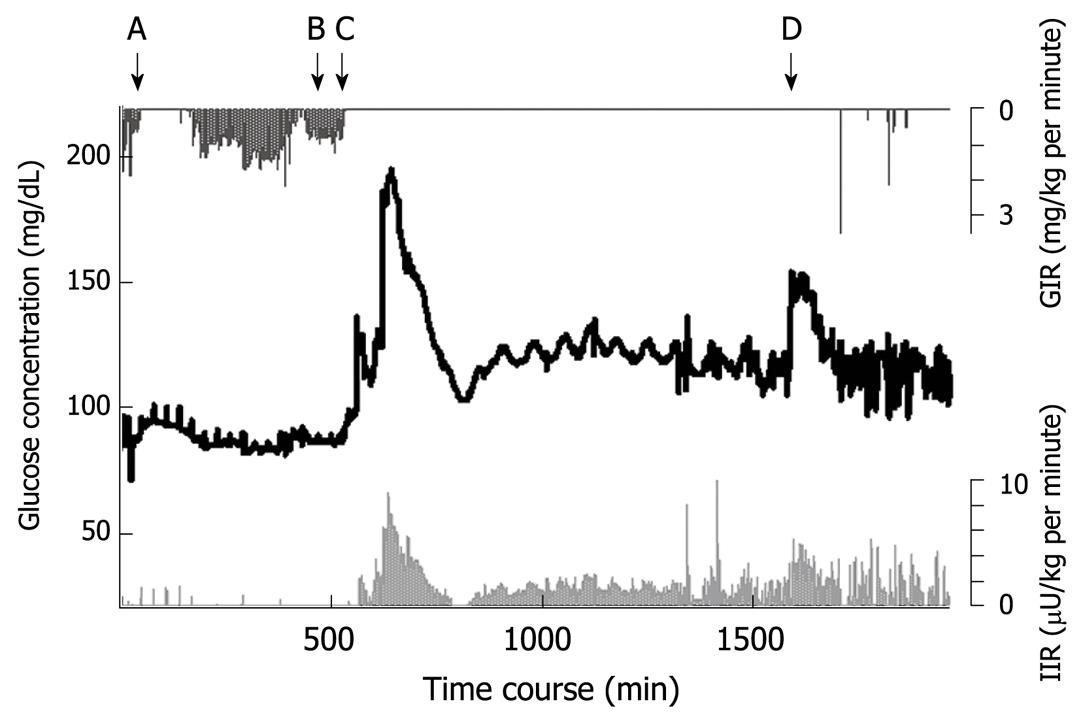
Figure 5 Blood glucose concentration during and after total pancreatectomy in a middle-aged female patient.
Blood glucose is shown by the black line. The insulin infusion rate (light grey line) increased according to the increase in glucose concentration. A: Beginning of surgery; B: Wound closure; C: Beginning of parenteral nutrition in ICU; D: Beginning of combined enteral and parenteral nutrition; GIR: Glucose infusion rate; IIR: Insulin infusion rate.
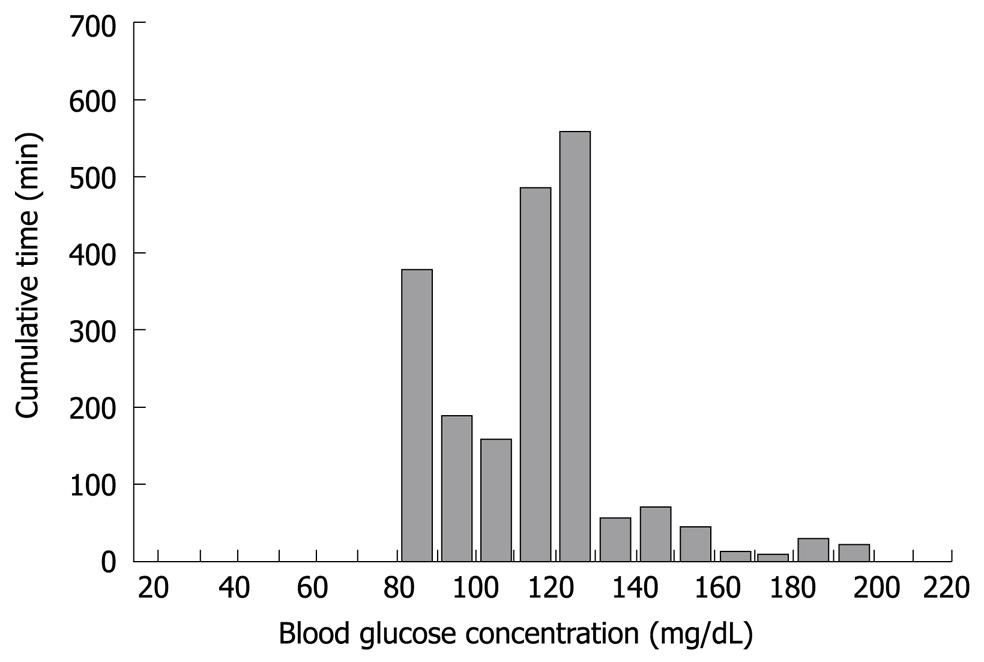
Figure 6 Histogram depicting the range and cumulative time for the blood glucose concentration of a middle-aged female who underwent total pancreatectomy.
- Citation: Maeda H, Okabayashi T, Yatabe T, Yamashita K, Hanazaki K. Perioperative intensive insulin therapy using artificial endocrine pancreas in patients undergoing pancreatectomy. World J Gastroenterol 2009; 15(33): 4111-4115
- URL: https://www.wjgnet.com/1007-9327/full/v15/i33/4111.htm
- DOI: https://dx.doi.org/10.3748/wjg.15.4111


