Copyright
©2009 The WJG Press and Baishideng.
World J Gastroenterol. Apr 21, 2009; 15(15): 1816-1820
Published online Apr 21, 2009. doi: 10.3748/wjg.15.1816
Published online Apr 21, 2009. doi: 10.3748/wjg.15.1816
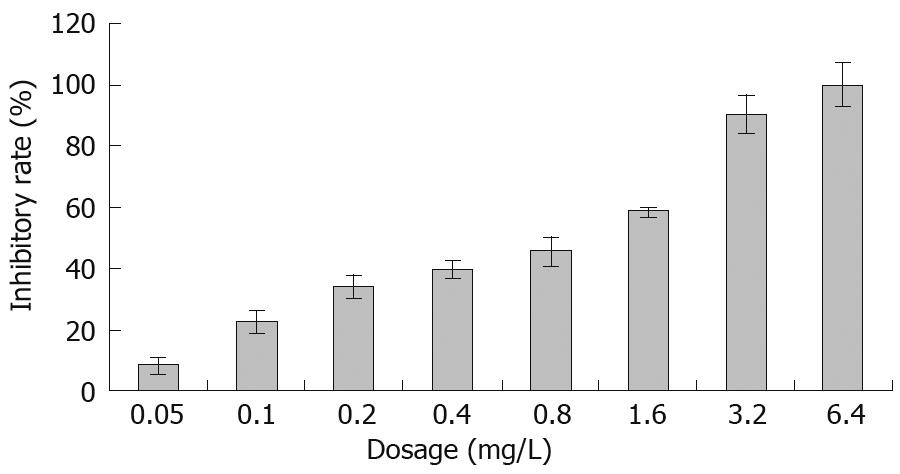
Figure 1 Effect of acetylshikonin on proliferation of SGC-7901 cells in vitro.
SGC-7901 cells were treated with various concentrations of acetylshikonin for 48 h. Tumor growth inhibitory rate was determined by MTT assay.
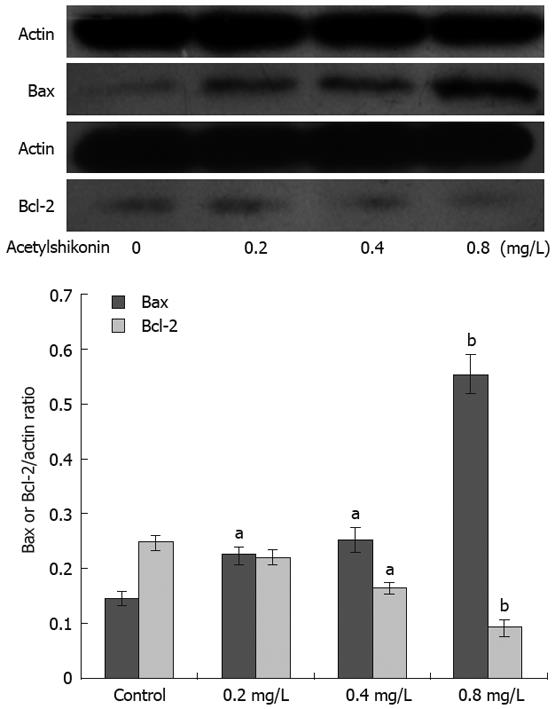
Figure 2 Effect of acetylshikonin on expression of Bcl-2 and Bax in SGC-7901 cells.
Lower panel: Ratios of protein quantitation of Bcl-2 or Bax to actin. Each experiment was independently performed three times. aP < 0.05, bP < 0.01 vs control group.
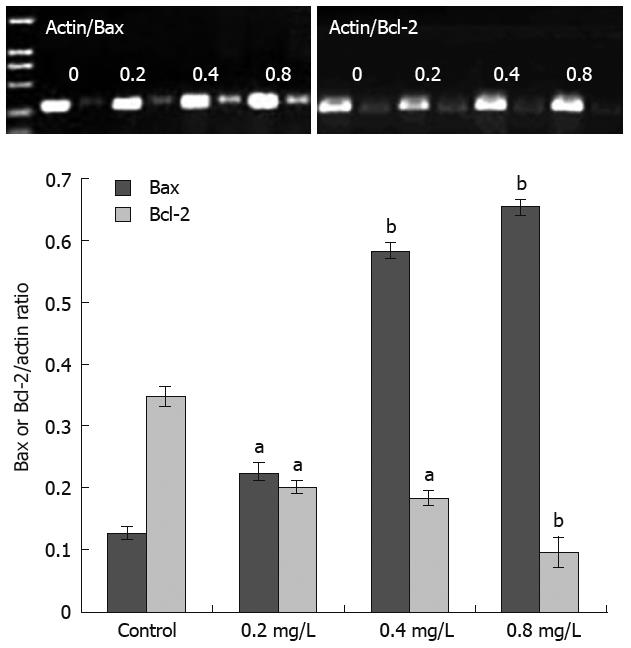
Figure 3 Effect of acetylshikonin on Bcl-2 and Bax mRNA expression levels in SGC-7901 cells.
Lower panel: Ratios of mRNA quantitation of Bcl-2 or Bax to actin. Each experiment was independently performed three times. aP < 0.05, bP < 0.01 vs control group.
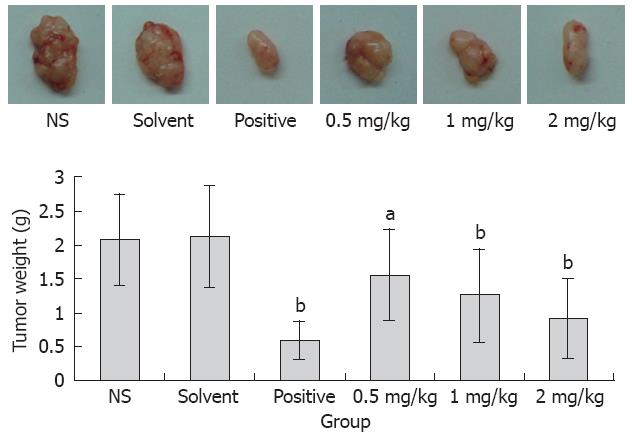
Figure 4 Anti-tumor effects of acetylshikonin in vivo.
Representative tumors from each group were shown. Lower panel: Average tumor weight of sacrificed animals. aP < 0.05, bP < 0.01 vs control group.
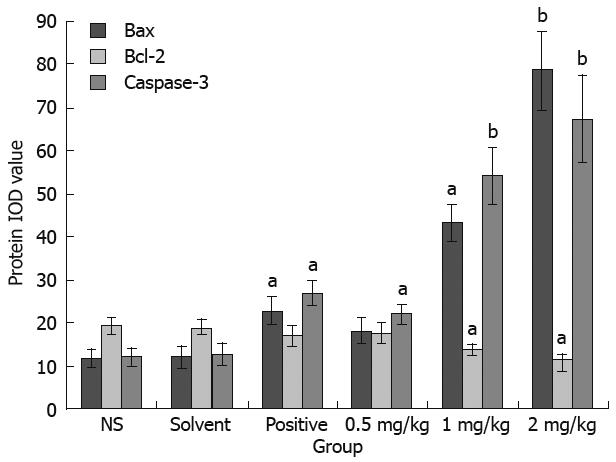
Figure 5 Effect of acetylshikonin on expression of Bax, Bcl-2 and Caspase 3 in SGC-7901 tumor tissues.
Tumor tissue sections showed strong Bax/Caspase 3 cytoplasmic staining and weak Bcl-2 cytoplasmic staining of tumor cells in acetylshikon treatment groups, as well as the integrated optical density (IOD) for the expression of Bax, Bcl-2 and Caspase 3 in SGC-7901 cells. aP < 0.05, bP < 0.01 vs control group.
-
Citation: Zeng Y, Liu G, Zhou LM. Inhibitory effect of acetylshikonin on human gastric carcinoma cell line SGC-7901
in vitro andin vivo . World J Gastroenterol 2009; 15(15): 1816-1820 - URL: https://www.wjgnet.com/1007-9327/full/v15/i15/1816.htm
- DOI: https://dx.doi.org/10.3748/wjg.15.1816


