Copyright
©2009 The WJG Press and Baishideng.
World J Gastroenterol. Apr 14, 2009; 15(14): 1751-1758
Published online Apr 14, 2009. doi: 10.3748/wjg.15.1751
Published online Apr 14, 2009. doi: 10.3748/wjg.15.1751
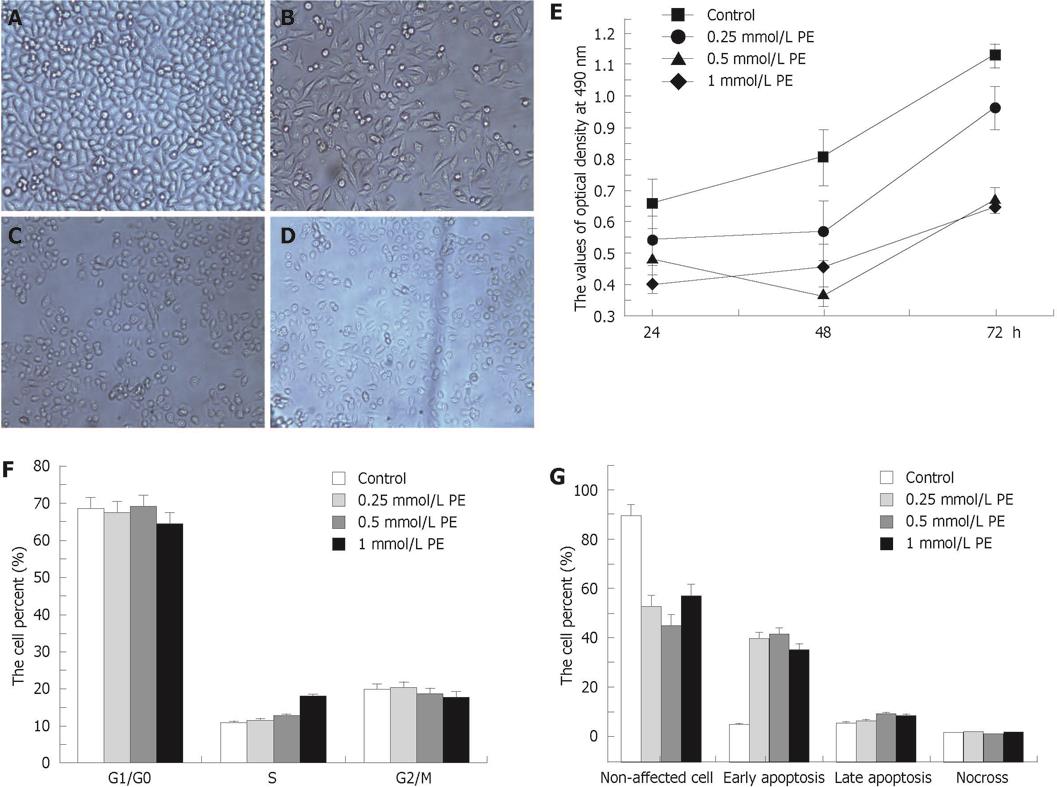
Figure 1 Effect of exogenous PE on the growth and apoptosis of human hepatoma HepG2 cells.
A: Control group; B: 0.25 mmol/L PE; C: 0.5 mmol/L PE; D: 1 mmol/L PE; E: 48 h after treatment, inhibition of cell growth shown by MTT assay; F: Cell cycle in human hepatoma HepG2 cells shown by PI staining 24 h after PE treatment, with data showing the cell percentages at G1/G0, S and G2 phases; G: Apoptosis of human hepatoma HepG2 cells shown by annexin-V/PI staining 24 h after PE treatment, with data showing the percentages of non-affected, early and late apoptotic cells and necrosis. The results are given as mean ± SD from three experiments.
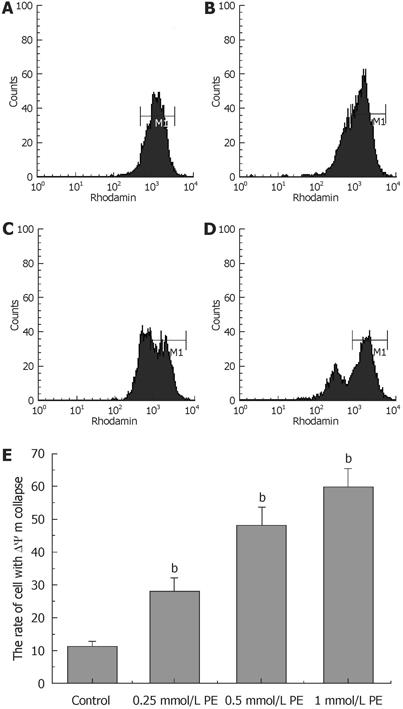
Figure 2 Effects of exogenous PE on the δΨm of human hepatoma HepG2 cells.
A: Control group; B, C, D: Groups treated with 0.25, 0.5 and 1 mmol/L PE at 24 h; E: Flow cytometry analysis of cells with δΨm collapse in human hepatoma HepG2 cells shown by rhodamine staining at 24 h. The results are given as mean ± SD from three repeat experiments. bP < 0.01 vs control group.
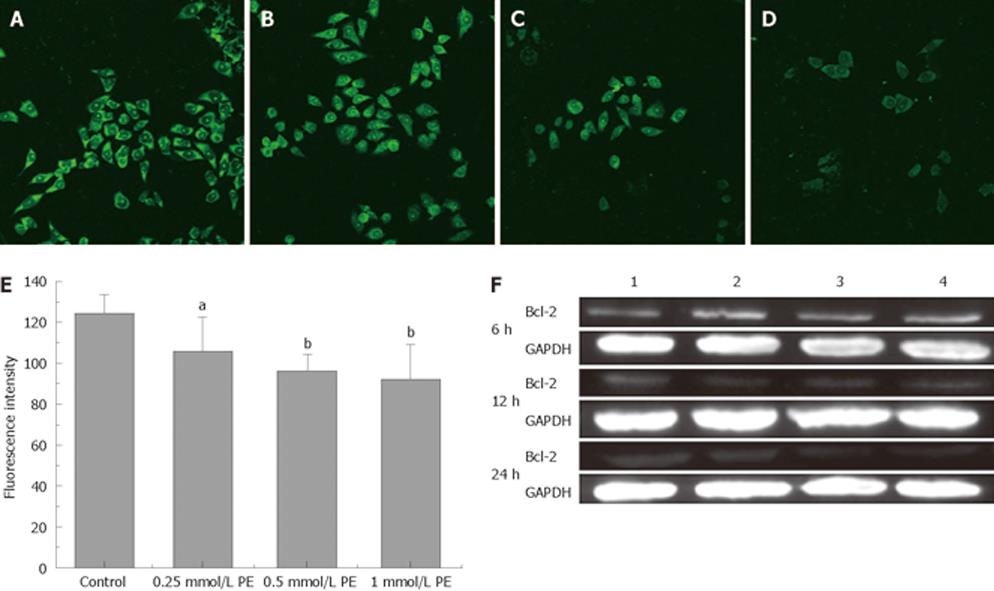
Figure 3 Inhibitory effect of exogenous PE on bcl-2 expression in human hepatoma HepG2.
A: Cells in control group; B: 0.25 mmol/L PE; C: 0.5 mmol/L PE; D: 1 mmol/L PE; E: Fluorescence intensity; F: 48 h after treatment and Western blotting. The results are presented as mean ± SD. Lane 1: Control group; lanes 2-4: 0.25, 0.5 and 1 mmol/L PE treatment groups. aP < 0.05, bP < 0.01 vs control group.
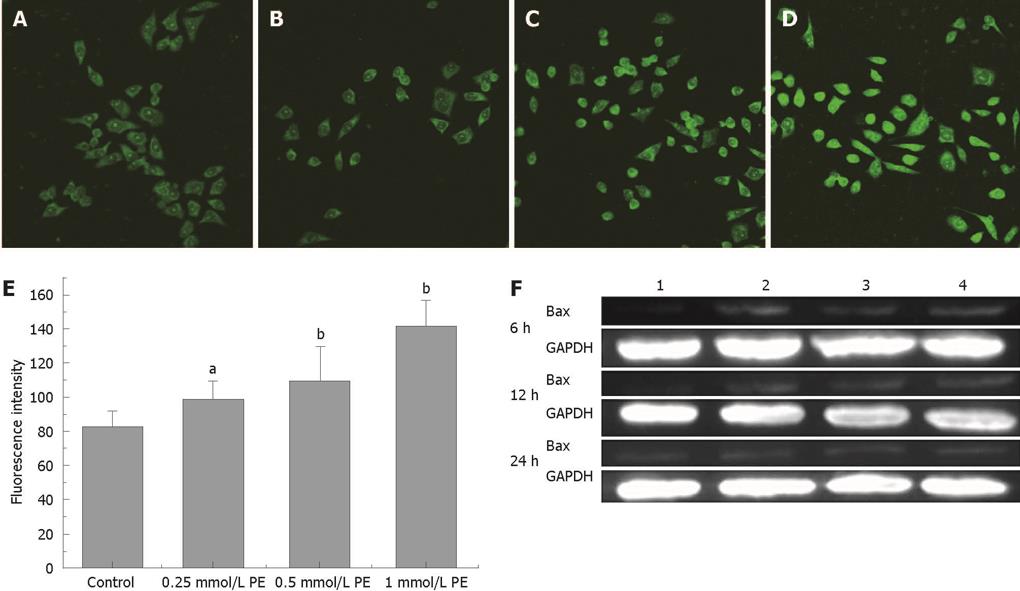
Figure 4 Inhibitory effects of exogenous PE on bax expression in human hepatoma HepG2 cells.
A: Control group; B: 0.25 mmol/L PE; C: 0.5 mmol/L PE; D: 1 mmol/L PE; E: Fluorescence intensity, F: 48 h after treatment and Western blotting. The results are presented as mean ± SD. Lane 1: Control group; lanes 2-4: 0.25, 0.5 and 1 mmol/L PE treatment groups. aP < 0.05, bP < 0.01 vs control group.
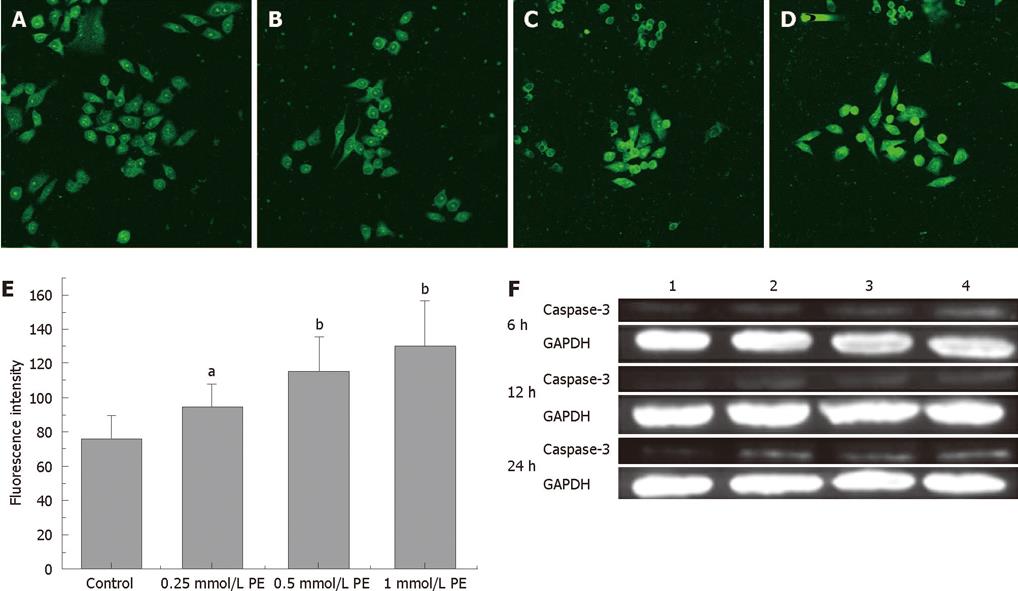
Figure 5 Inhibitory effect of exogenous PE on caspase-3 expression in human hepatoma HepG2 cells.
A: control group; B: 0.25 mmol/L PE; C: 0.5 mmol/L PE; D: 1 mmol/L PE; E: Fluorescence intensity, F: 48 h after treatment and Western blotting. The results are presented as mean ± SD. Lane 1: Control group; lanes 2-4: 0.25, 0.5 and 1 mmol/L PE treatment groups. aP < 0.05, bP < 0.01 vs control group.
-
Citation: Yao Y, Huang C, Li ZF, Wang AY, Liu LY, Zhao XG, Luo Y, Ni L, Zhang WG, Song TS. Exogenous phosphatidylethanolamine induces apoptosis of human hepatoma HepG2 cells
via the bcl-2/bax pathway. World J Gastroenterol 2009; 15(14): 1751-1758 - URL: https://www.wjgnet.com/1007-9327/full/v15/i14/1751.htm
- DOI: https://dx.doi.org/10.3748/wjg.15.1751


