Copyright
©2009 The WJG Press and Baishideng.
World J Gastroenterol. Apr 14, 2009; 15(14): 1751-1758
Published online Apr 14, 2009. doi: 10.3748/wjg.15.1751
Published online Apr 14, 2009. doi: 10.3748/wjg.15.1751
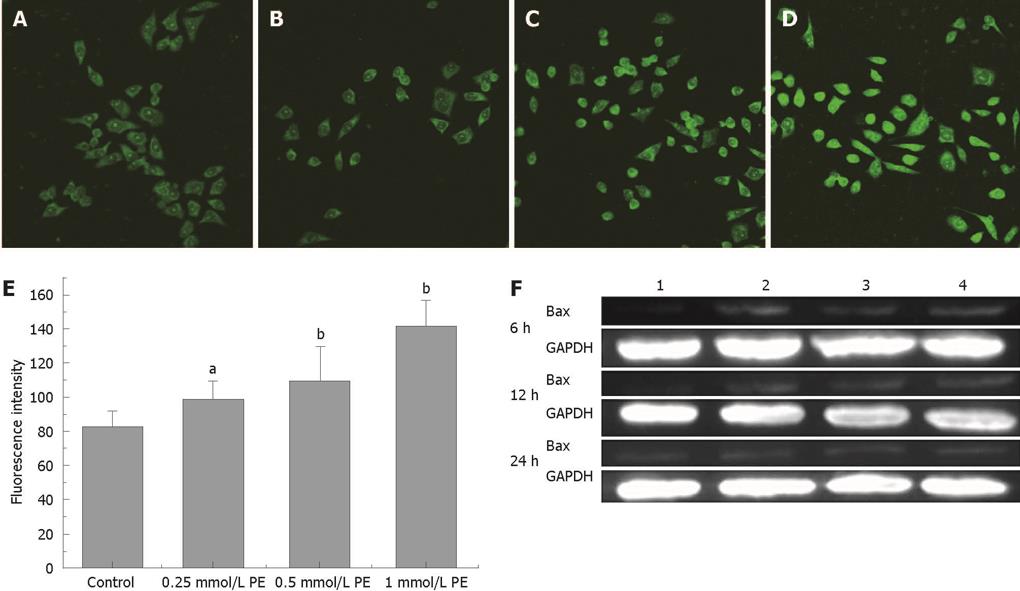
Figure 4 Inhibitory effects of exogenous PE on bax expression in human hepatoma HepG2 cells.
A: Control group; B: 0.25 mmol/L PE; C: 0.5 mmol/L PE; D: 1 mmol/L PE; E: Fluorescence intensity, F: 48 h after treatment and Western blotting. The results are presented as mean ± SD. Lane 1: Control group; lanes 2-4: 0.25, 0.5 and 1 mmol/L PE treatment groups. aP < 0.05, bP < 0.01 vs control group.
-
Citation: Yao Y, Huang C, Li ZF, Wang AY, Liu LY, Zhao XG, Luo Y, Ni L, Zhang WG, Song TS. Exogenous phosphatidylethanolamine induces apoptosis of human hepatoma HepG2 cells
via the bcl-2/bax pathway. World J Gastroenterol 2009; 15(14): 1751-1758 - URL: https://www.wjgnet.com/1007-9327/full/v15/i14/1751.htm
- DOI: https://dx.doi.org/10.3748/wjg.15.1751


