Copyright
©2008 The WJG Press and Baishideng.
World J Gastroenterol. Nov 14, 2008; 14(42): 6551-6559
Published online Nov 14, 2008. doi: 10.3748/wjg.14.6551
Published online Nov 14, 2008. doi: 10.3748/wjg.14.6551
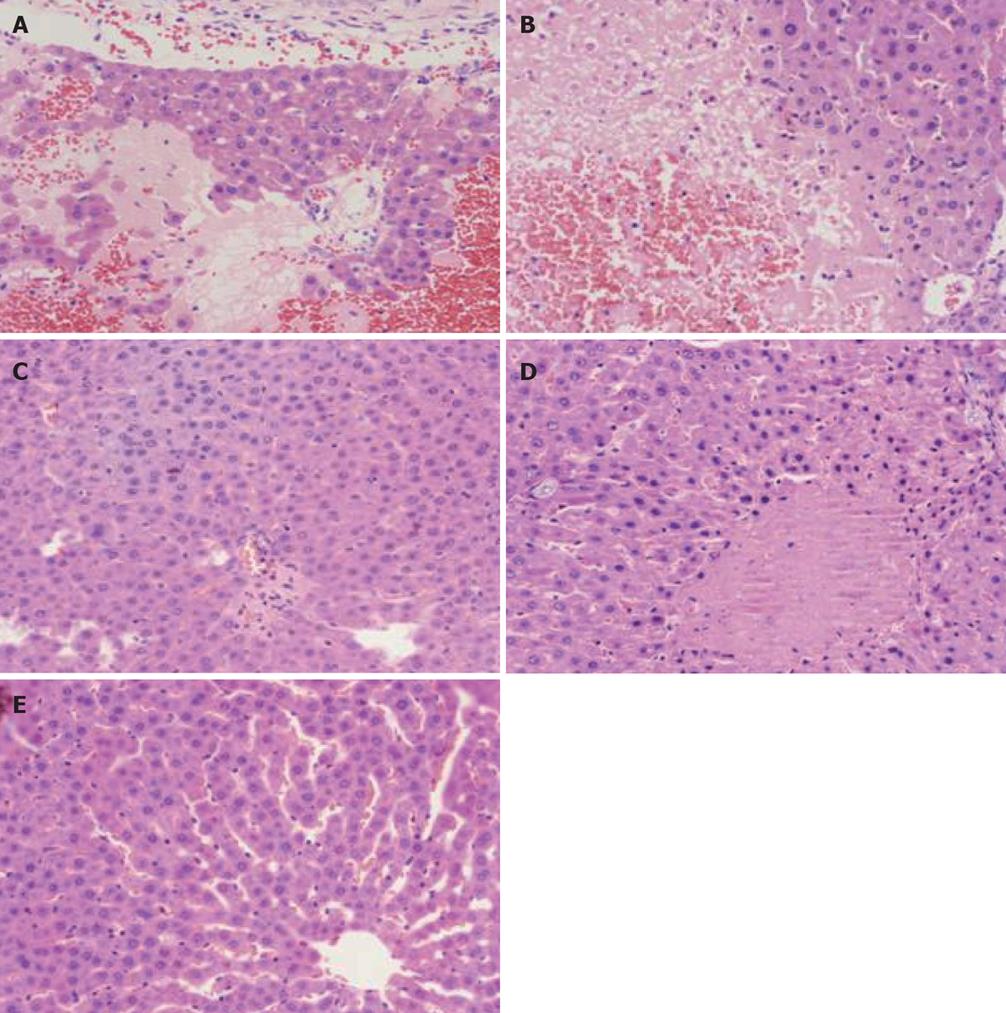
Figure 1 Pathological changes of liver under light microscope.
A: Lamellar hemorrhagic necrosis, model control group (6 h); B: Massive hemorrhagic necrosis, model control group (12 h); C: Spotty necrosis of liver cell, Baicalin treated group (12 h); D: Piecemeal necrosis, Octreotide treated group (12 h); E: Normal liver, sham-operated group (12 h). (HE, × 200).
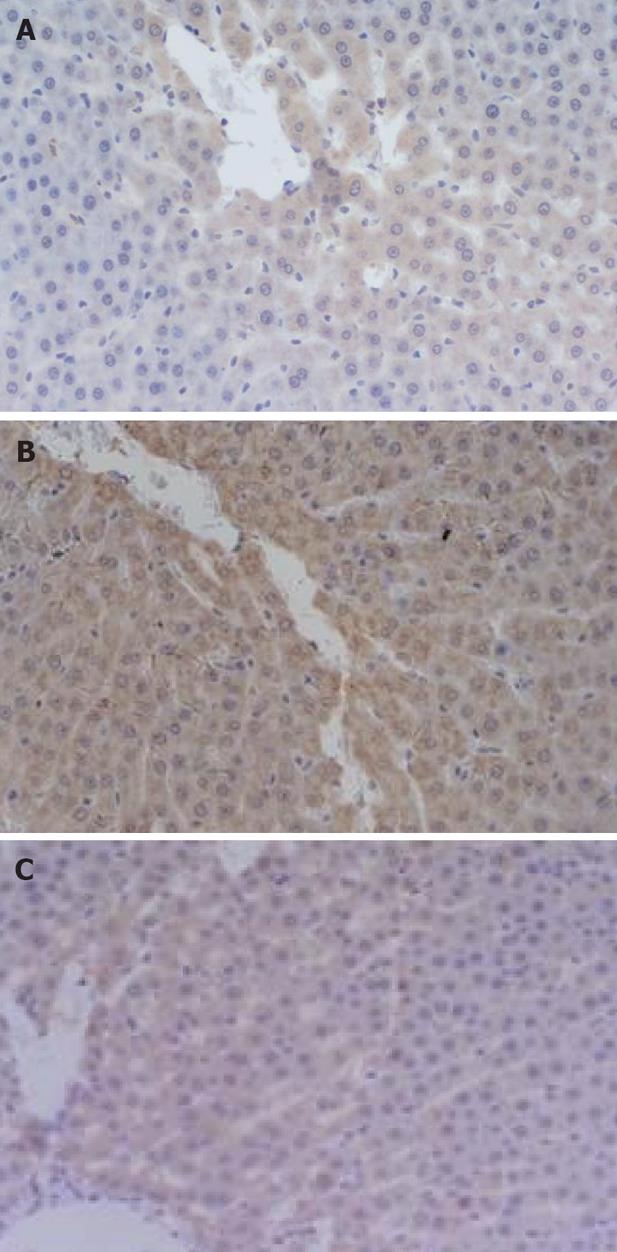
Figure 2 TMA of liver was prepared and immunohistochemical staining.
A: Bax protein expression level was “++”, model control group (3 h); B: Bcl-2 protein expression level was “+++”, model control group (6 h); C: Caspase 3 protein expression level was “++”, Octreotide treated group (6 h). (× 200).
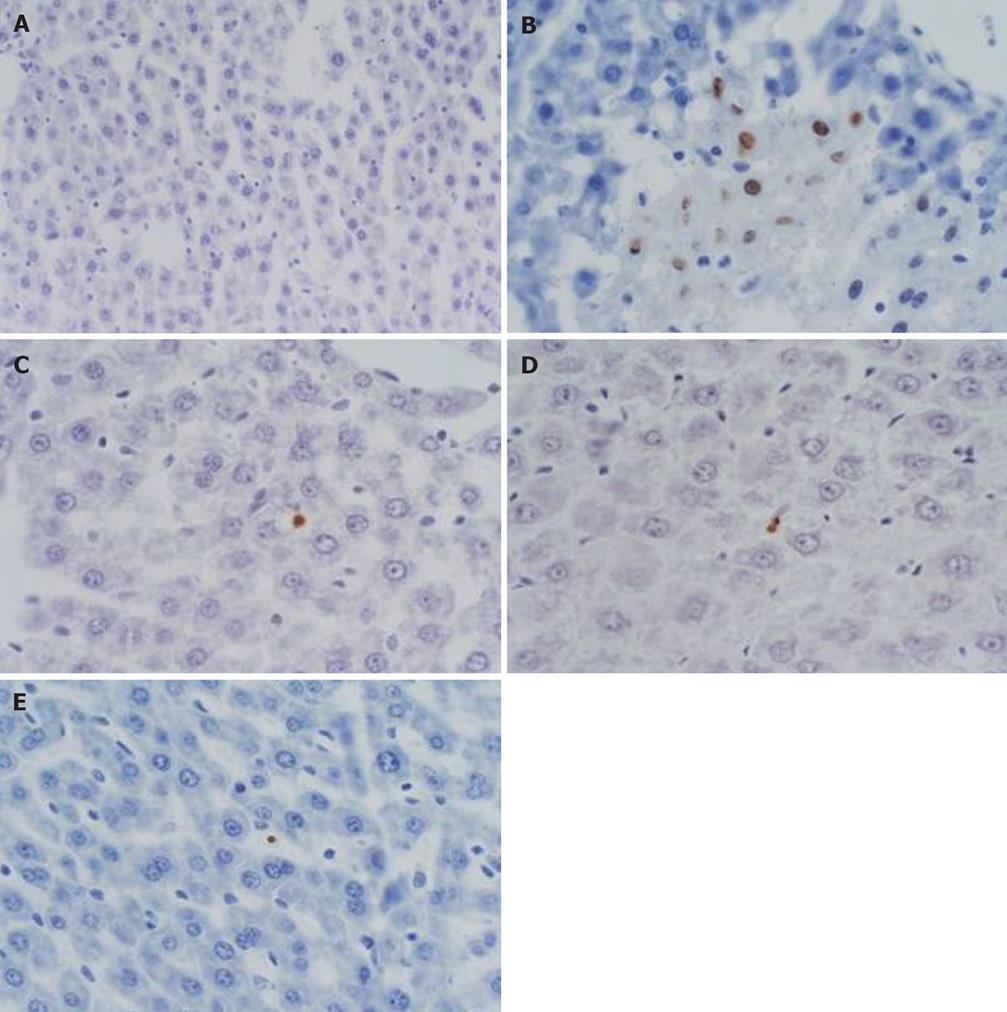
Figure 3 TMA of liver was prepared and conduced TUNEL staining, observing the changes of apoptotic indexes.
A: model control group (3 h), there was no apoptotic cell; B: Baicalin treated group (3 h), several hepatic apoptotic cells appeared; C: Baicalin treated group (6 h), several apoptotic hepatic Kupffer cells; D: Baicalin treated group (12 h), several apoptotic hepatic Kupffer's cells; E: Octreotide treated group (3 h), several apoptotic hepatic Kupffer's cells. (TUNEL, × 400).
- Citation: Zhang XP, Zhang J, Ren Z, Feng GH, Zhu W, Cai Y, Yang QJ, Ju TF, Xie Q, Yuan WQ. Study on protecting effects of Baicalin and Octreotide on hepatic injury in rats with severe acute pancreatitis. World J Gastroenterol 2008; 14(42): 6551-6559
- URL: https://www.wjgnet.com/1007-9327/full/v14/i42/6551.htm
- DOI: https://dx.doi.org/10.3748/wjg.14.6551


