Copyright
©2008 The WJG Press and Baishideng.
World J Gastroenterol. Oct 14, 2008; 14(38): 5797-5809
Published online Oct 14, 2008. doi: 10.3748/wjg.14.5797
Published online Oct 14, 2008. doi: 10.3748/wjg.14.5797
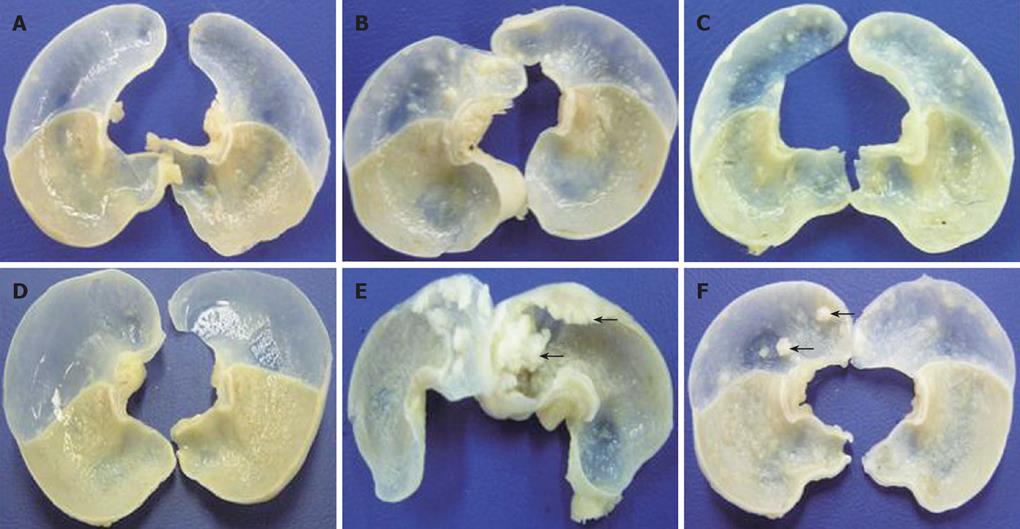
Figure 1 Forestomach tumors (arrow) in BaP-treated mice with/without depletion of Tregs.
Mice were sacrificed at wk 16 (A-C) and wk 32 (D-F) after the first administration of benzo[a]pyrene (BaP) in control mice (A and D), BaP + IgG-treated mice (B and E), and BaP + PC61-treated mice (C and F). After depletion of Tregs by PC61, the size and volume of forestomach carcinoma reduced significantly.
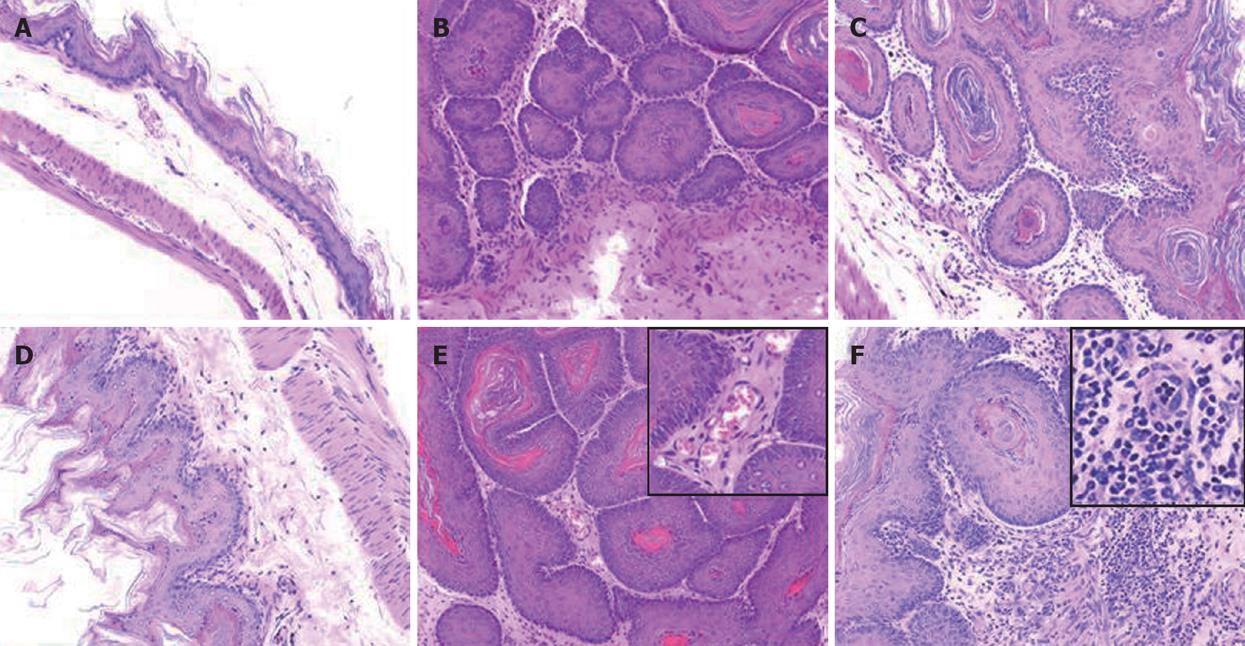
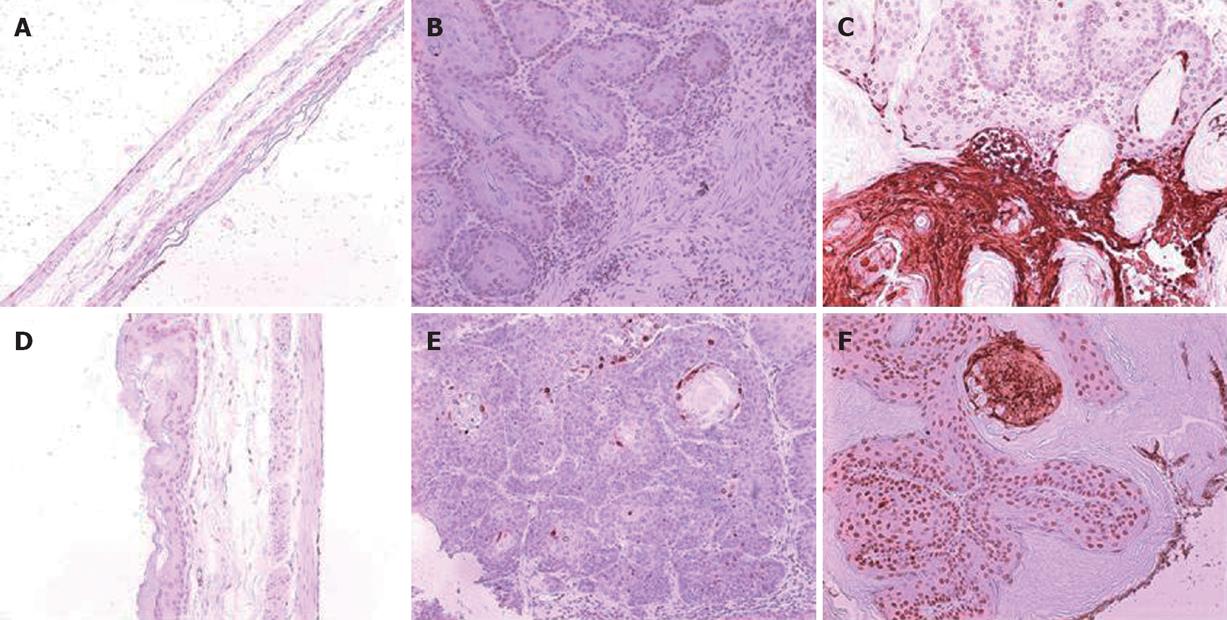
Figure 2 Histology of forestomach carcinoma in mice.
Mice were sacrificed at wk 16 (A-C) and wk 32 (D-F) with their stomachs excised. The number of squamous cell carcinomas was increased in BaP + IgG-treated (B, E) and BaP + PC61-treated mice (C, F). However, there was a significant infiltration of lymphocytes and granulocytes into tumors of BaP + PC61-treated mice (F, inset). A and D: control mice; B and E: BaP + IgG-treated mice; C and F: BaP + PC61-treated mice.
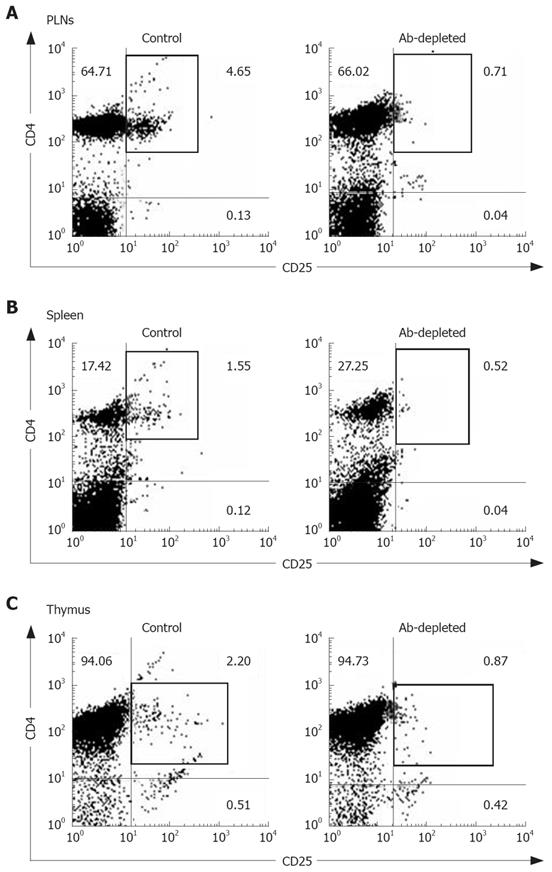
Figure 3 Flow cytometry showing reduced CD4+CD25+ T cells in PLNs (A), spleen (B), and thymus (C) of antibody-treated mice.
Cells were double-stained with anti-CD4 and anti-CD25 Ab.
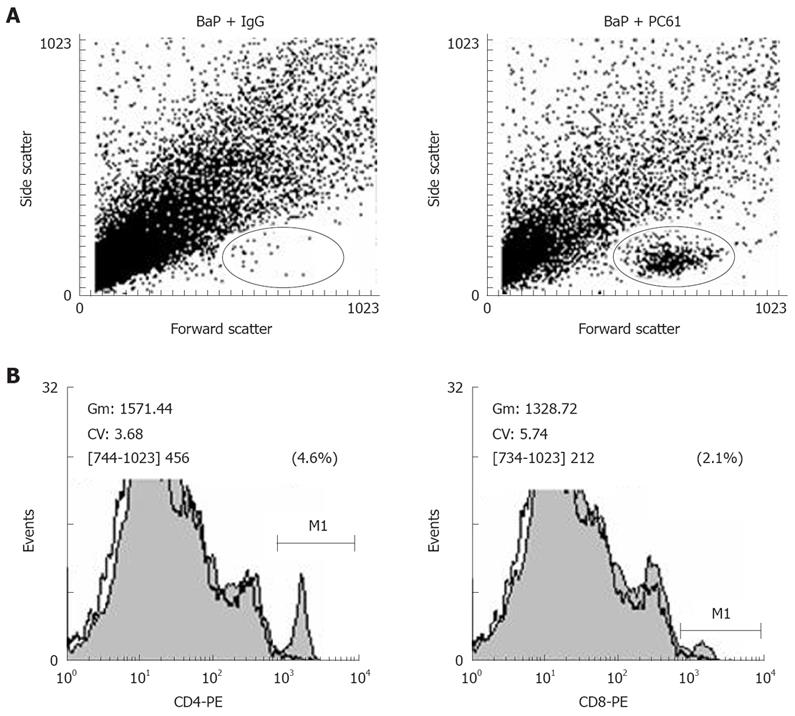
Figure 4 Flow cytometry showing lymphocyte infiltration of the stomach in Treg-undepleted/-depleted mice (A) and cells stained with PE-conjugated anti-CD4, CD8 mAb (solid peak) and isotype control (hollow peak), and the infiltration of CD4+ and CD8+ cells of the stomach quantified in Treg-depleted mice (B).
Figure 5 Apoptotic cells in forestomach tumors.
Apoptotic cells were detected by TUNEL-staining as described in Materials and Methods. Apoptotic cells were revealed by a brown color. Stomach tumor nodules of mice were surgically obtained at wk 16 (A-C) and wk 32 (D-F) after the first administration of BaP. Significant apoptotic cells were found at wk 32 in BaP + PC61-treated mice. A and D: Control mice; B and E: BaP+IgG-treated mice; C and F: BaP + PC61-treated mice.
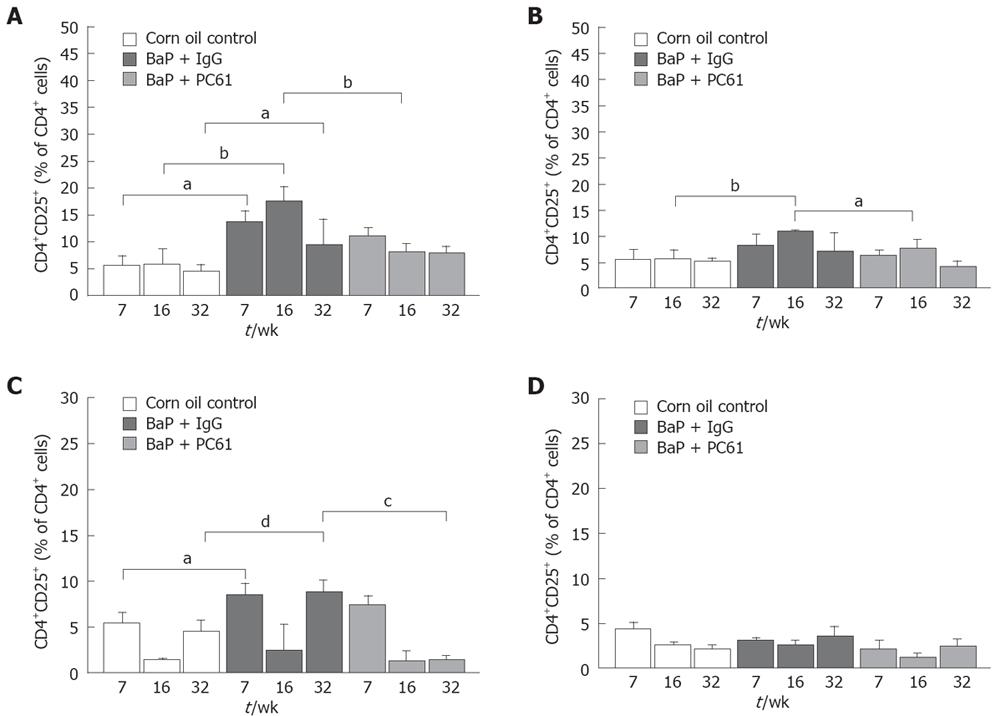
Figure 6 CD4+CD25+ T cells in distinct microenvironments.
Lymphocytes in RLNs (A), PLNs (B), spleen (C), and thymus (D) were double-stained with FITC-anti-CD25 and PE-anti-CD4 mAbs and quantified by flow cytometry in the control, BaP + IgG-treated, and BaP + PC61-treated mice at wk 7, wk 16, and wk 32. aP < 0.05, bP < 0.01, cP < 0.005, dP < 0.001 vs the control mice.
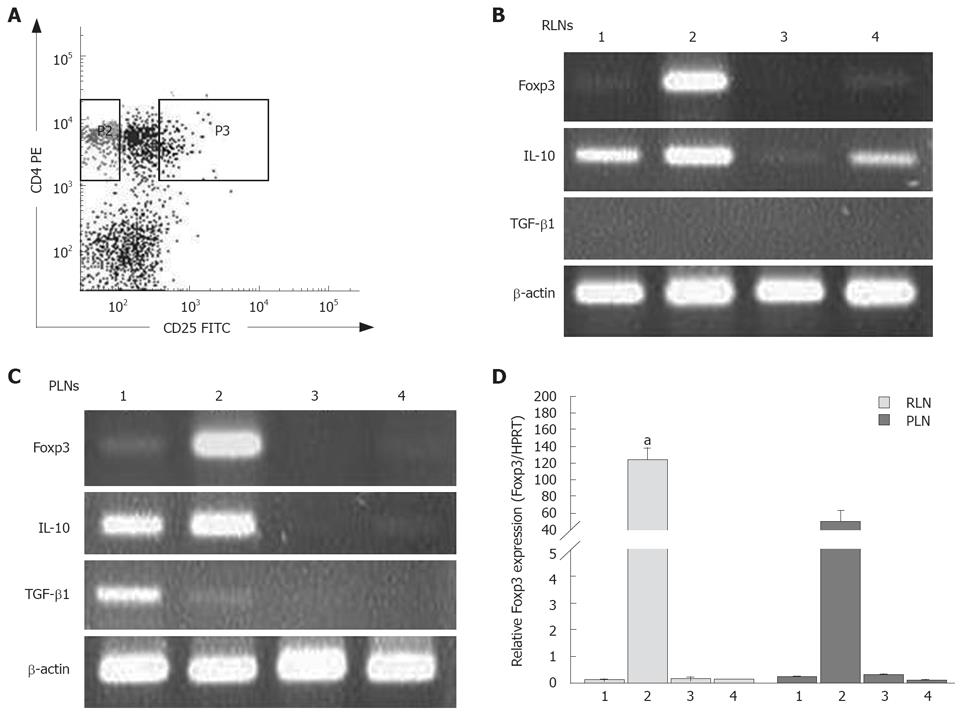
Figure 7 CD4+CD25+ T cells express high levels of Foxp3 transcripts in RLNs and PLNs of CD4+CD25- (P2) and CD4+CD25+ (P3) T cells (A) which were sorted and stained with FITC-anti-CD25 and PE-anti-CD4 mAbs, and of Foxp3, IL-10, TGF-β1, and β-actin mRNA in CD4+CD25+ and CD4+CD25- cells of RLNs (B) and PLNs (C) in BaP-only-treated and control mice at wk 32 using RT-PCR (Lanes 1 and 2: BaP-only-treated mice; Lanes 3 and 4: control mice; Lanes 1 and 3: CD4+CD25- cells; Lanes 2 and 4: CD4+CD25+ cells), as well as of relative Foxp3 from CD4+CD25- and CD4+CD25+ T cells using real-time quantitative PCR after normalization to HPRT expression (D).
aP < 0.05 vs control mice.
Figure 8 Expression of Foxp3 protein of RLNs (A) and PLNs (B) in BaP-only-treated mice at wk 32 and quantified by flow cytometry (C).
Foxp3 expression was determined as described in Materials and Methods. The histogram demonstrates FITC-conjugated Foxp3 staining (solid peak) and isotype control (hollow peak). aP < 0.05 vs control mice.
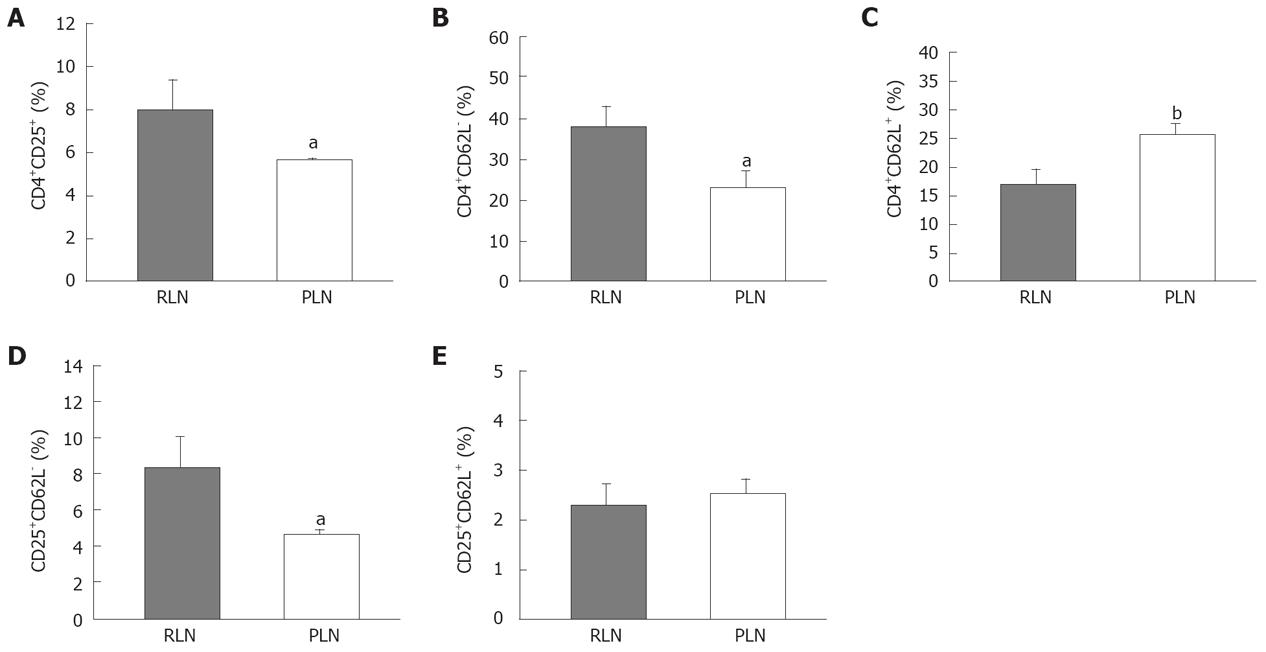
Figure 9 Surface expression of CD4+CD25+ (A), CD4+CD62L- (B), CD4+CD62L+ (C), CD25+CD62L-(D), and CD25+CD62L+ (E) in RLNs and PLNs of BaP-only-treated mice at wk 32.
aP < 0.05, bP < 0.01 vs control mice.
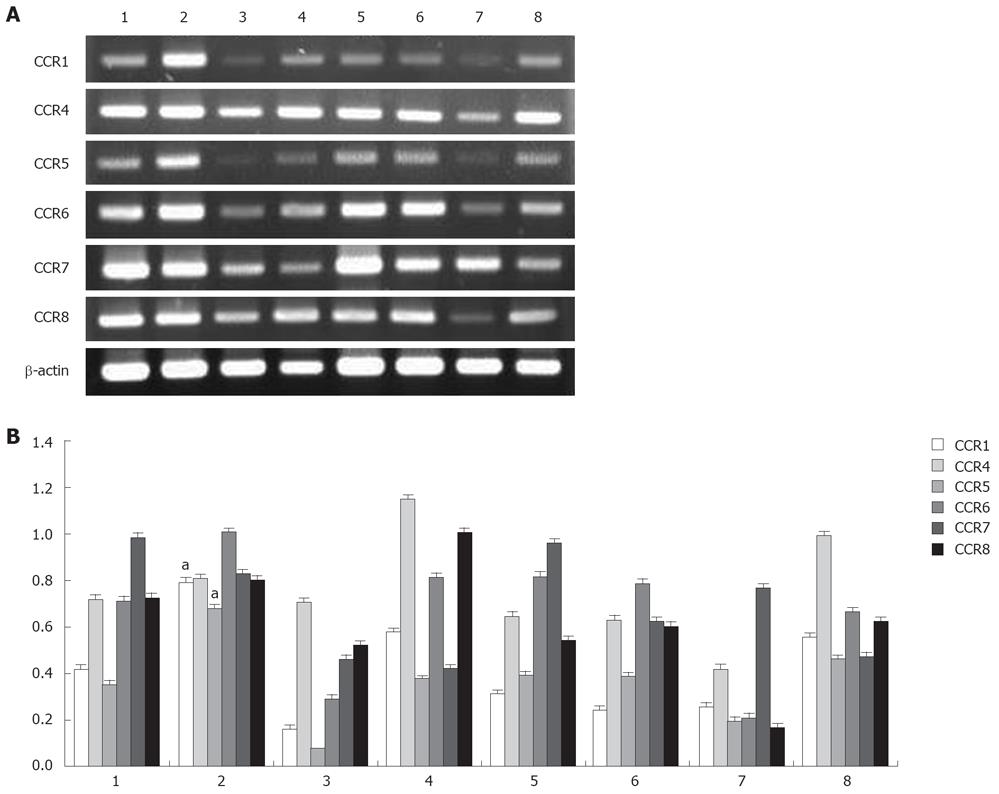
Figure 10 PCR analysis of chemokine receptor transcripts in CD4+CD25- and CD4+CD25+ cells (A).
CCR1, CCR4, CCR5, CCR6, CCR7, CCR8, and β-actin mRNA expression of CD4+CD25- cells (lanes 1, 3, 5, 7) and CD4+CD25+ (lanes 2, 4, 6, 8) in RLNs (lanes 1-4) and PLNs (lanes 5-8) in BaP-only (lanes 1, 2, 5, 6) and control (lanes 3, 4, 7, 8) mice at 32 wk using RT-PCR. Relative expression of chemokine mRNA was compared (B). CD4+CD25+ cells expressed significantly higher levels of CCR1 (a) and CCR5 (a) mRNA. a: P < 0.05
- Citation: Chen YL, Fang JH, Lai MD, Shan YS. Depletion of CD4+CD25+ regulatory T cells can promote local immunity to suppress tumor growth in benzo[a]pyrene-induced forestomach carcinoma. World J Gastroenterol 2008; 14(38): 5797-5809
- URL: https://www.wjgnet.com/1007-9327/full/v14/i38/5797.htm
- DOI: https://dx.doi.org/10.3748/wjg.14.5797


