Copyright
©2008 The WJG Press and Baishideng.
World J Gastroenterol. Oct 7, 2008; 14(37): 5657-5664
Published online Oct 7, 2008. doi: 10.3748/wjg.14.5657
Published online Oct 7, 2008. doi: 10.3748/wjg.14.5657
Figure 1 2-DE maps of human gastric tissue separated by IPG with different pH intervals (silver staining).
A and B: Normal and cancer tissues of stomach separated by pH 3-10 IPG strips; C and D: Normal and cancer tissues of stomach separated by pH 5-8 IPG strips; E and F: Normal and cancer tissues of stomach separated by pH 4-7 IPG strips.
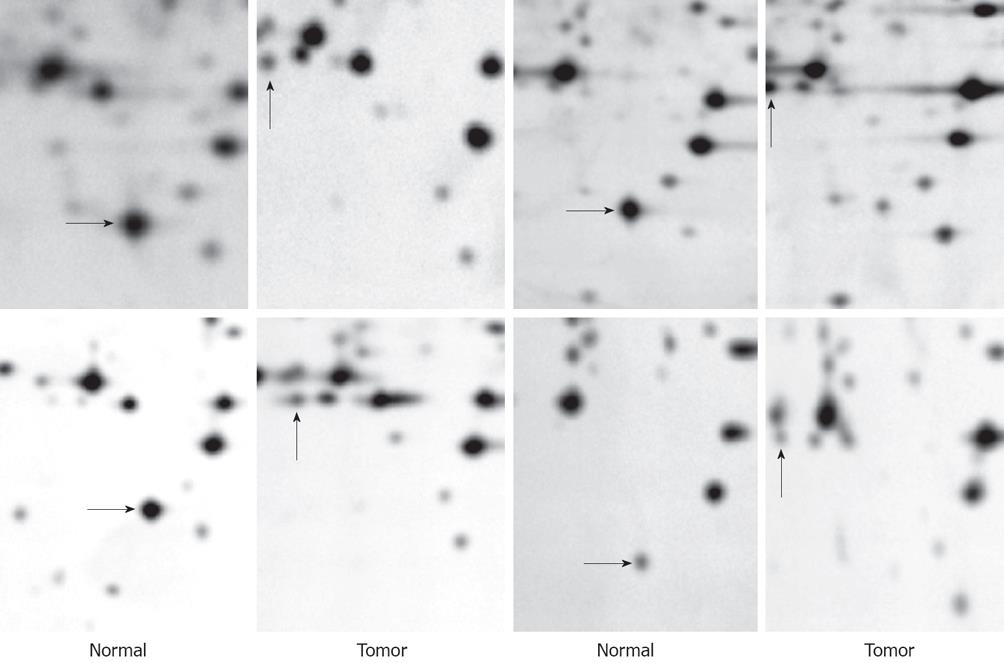
Figure 2 Up-regulation of T8 (Zinc finger protein 134, indicated by vertical arrows) and down-regulation of N4 (Bullous pemphigoid antigen 1 isoforms 6/9/10, indicated by horizontal arrows) in gastric cancer tissue of four patients.
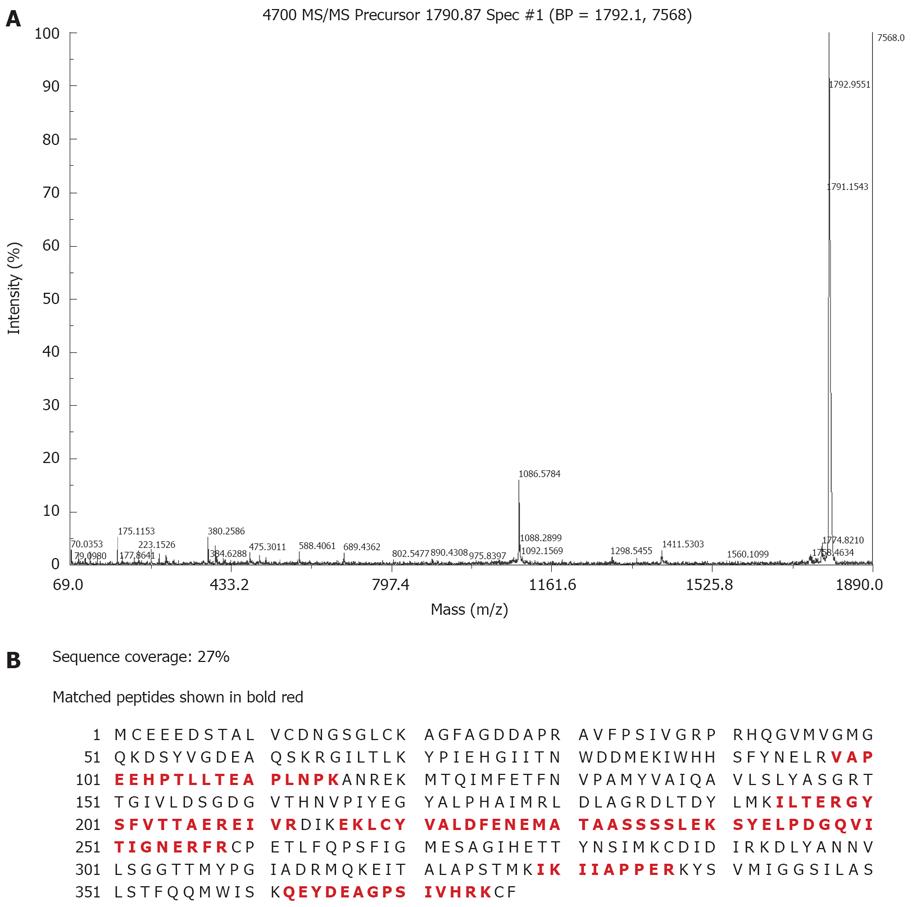
Figure 3 A: MALDI-TOF-TOF mass spectrum of the mixture of tryptic peptides derived from T8 (Actin, alpha cardiac); B: Matching of protein spot T8 (Actin, alpha cardiac) Peptide Mass Fingerprint data with protein P04270 in database.
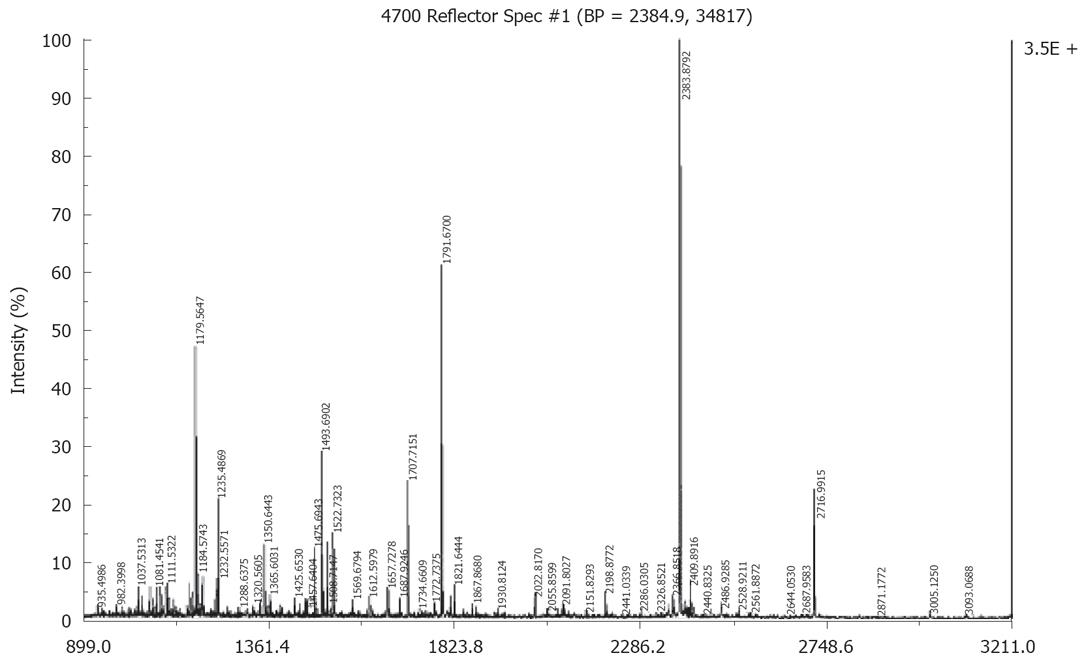
Figure 4 MALDI-TOF mass spectrum of the mixture of tryptic peptides derived from N4 (Bullous pemphigoid antigen 1 isoforms 6/9/10).
- Citation: Li W, Li JF, Qu Y, Chen XH, Qin JM, Gu QL, Yan M, Zhu ZG, Liu BY. Comparative proteomics analysis of human gastric cancer. World J Gastroenterol 2008; 14(37): 5657-5664
- URL: https://www.wjgnet.com/1007-9327/full/v14/i37/5657.htm
- DOI: https://dx.doi.org/10.3748/wjg.14.5657


