Copyright
©2008 The WJG Press and Baishideng.
World J Gastroenterol. Jan 14, 2008; 14(2): 307-312
Published online Jan 14, 2008. doi: 10.3748/wjg.14.307
Published online Jan 14, 2008. doi: 10.3748/wjg.14.307
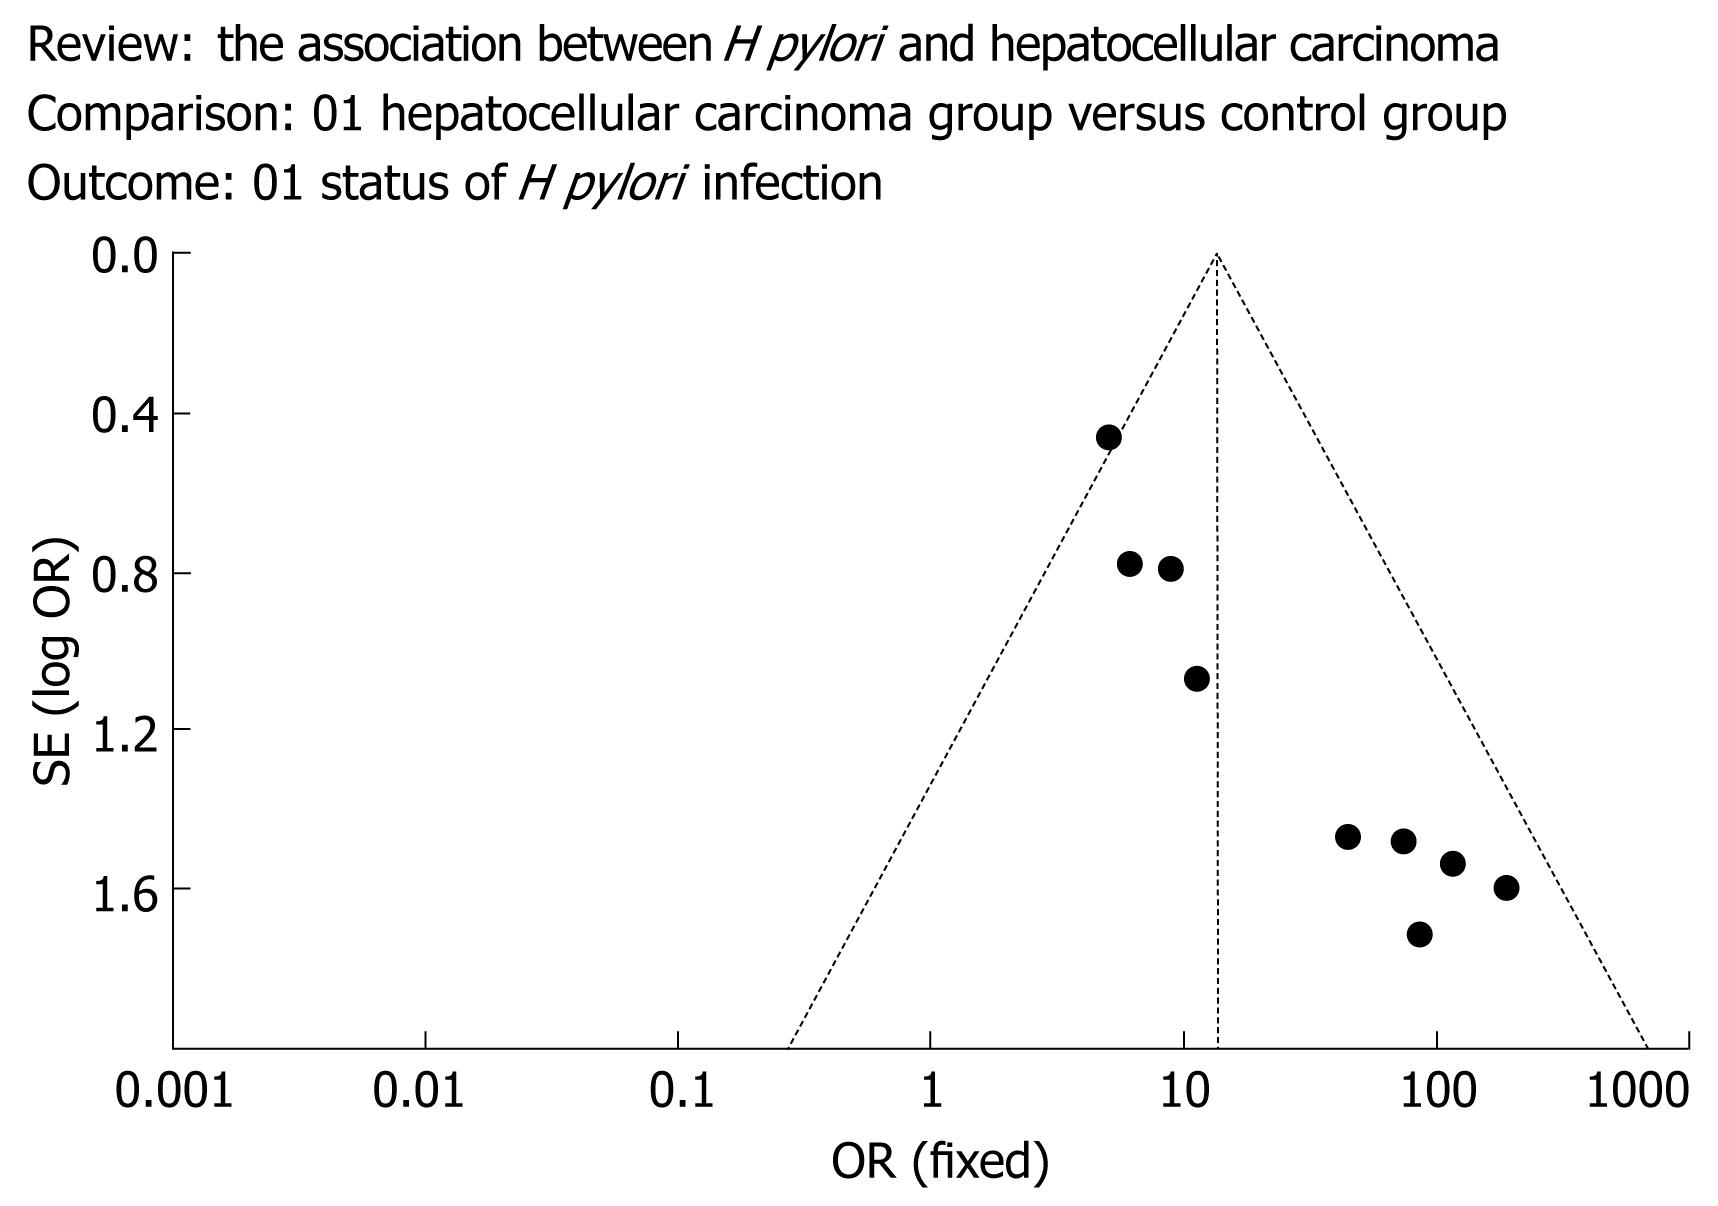
Figure 1 Funnel plot to explore publication bias.
The graphical funnel plot of the 10 published studies appears to be asymmetrical.
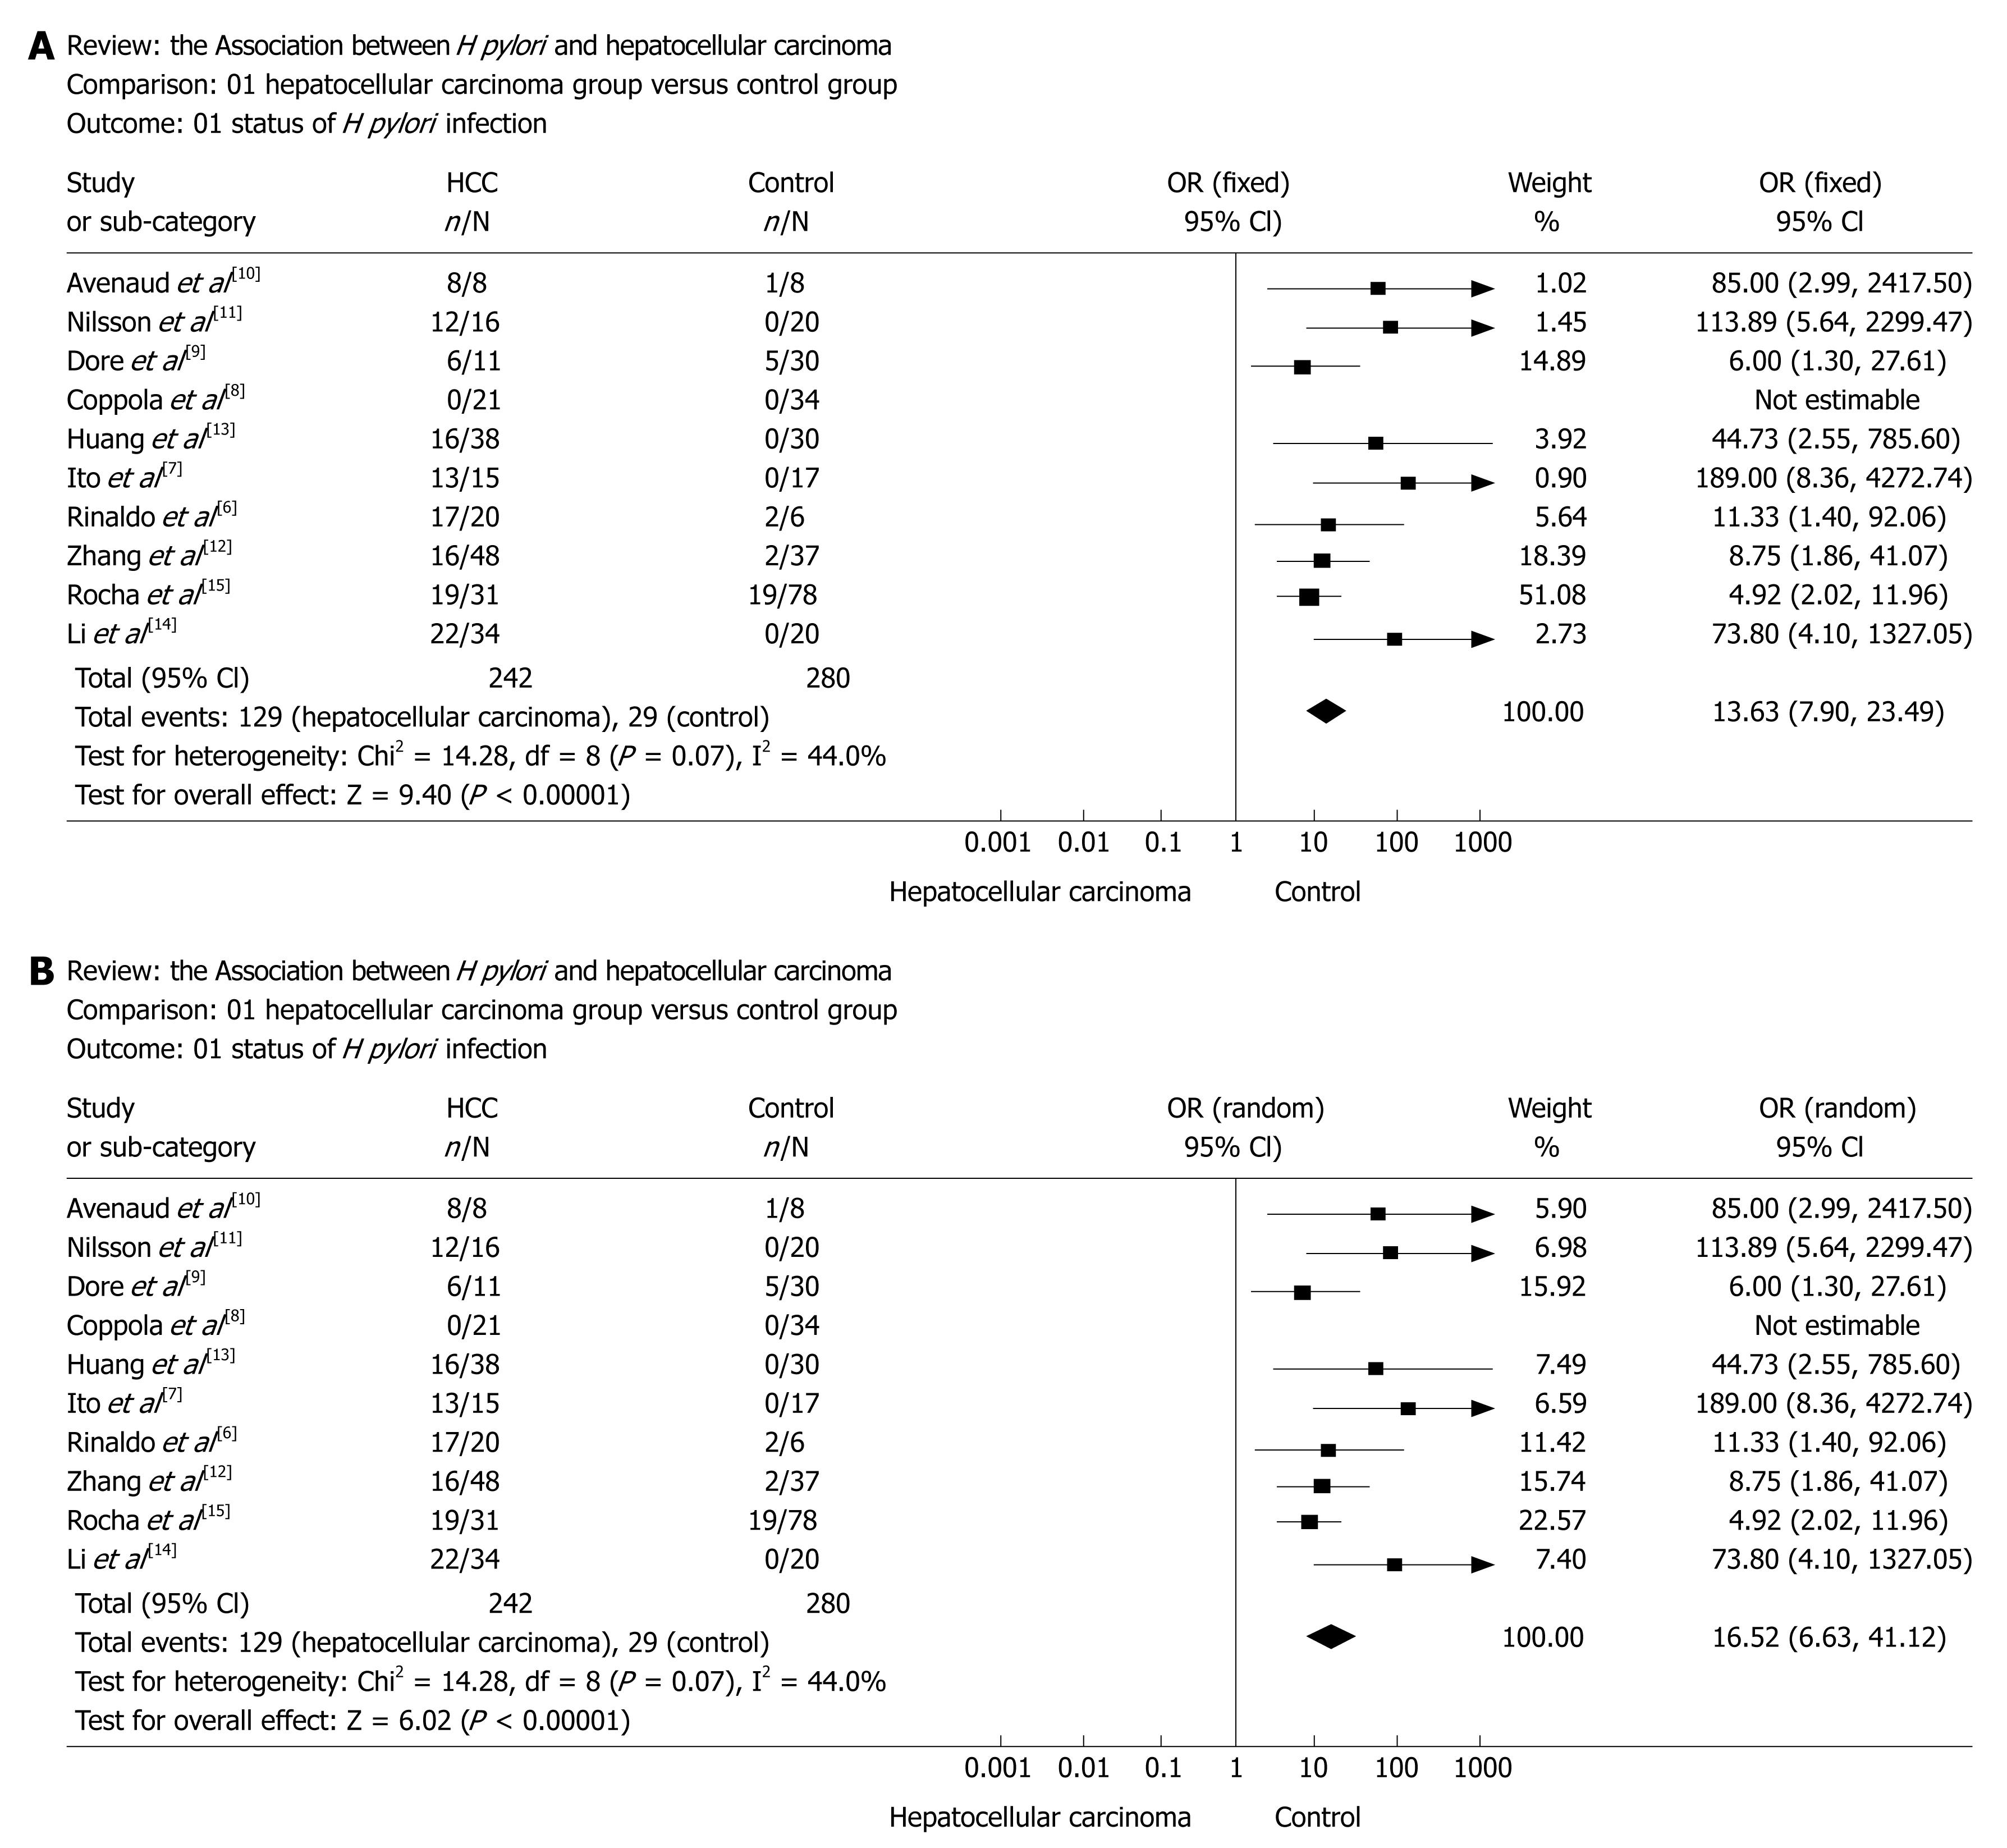
Figure 2 A: Forest plot of a meta-analysis of the association between H pylori and hepatocellular carcinoma risk (fixed-effects mode).
It shows the ORs and 95% CI of each study, and the summary OR determined by meta-analysis. The proportion of total variation in study estimates, because of heterogeneity, was 44.0% (heterogeneity test statistics χ2 = 14.28, on 8 df, P = 0.07, I2 = 44.0%); B: Sensitivity-analysis: A Forest plot of a meta-analysis of the association between H pylori and hepatocellular carcinoma risk (random-effects mode).
-
Citation: Xuan SY, Xin YN, Chen AJ, Dong QJ, Qiang X, Li N, Zheng MH, Guan HS. Association between the presence of
H pylori in the liver and hepatocellular carcinoma: A meta-analysis. World J Gastroenterol 2008; 14(2): 307-312 - URL: https://www.wjgnet.com/1007-9327/full/v14/i2/307.htm
- DOI: https://dx.doi.org/10.3748/wjg.14.307


