Copyright
©2007 Baishideng Publishing Group Co.
World J Gastroenterol. Feb 14, 2007; 13(6): 945-949
Published online Feb 14, 2007. doi: 10.3748/wjg.v13.i6.945
Published online Feb 14, 2007. doi: 10.3748/wjg.v13.i6.945
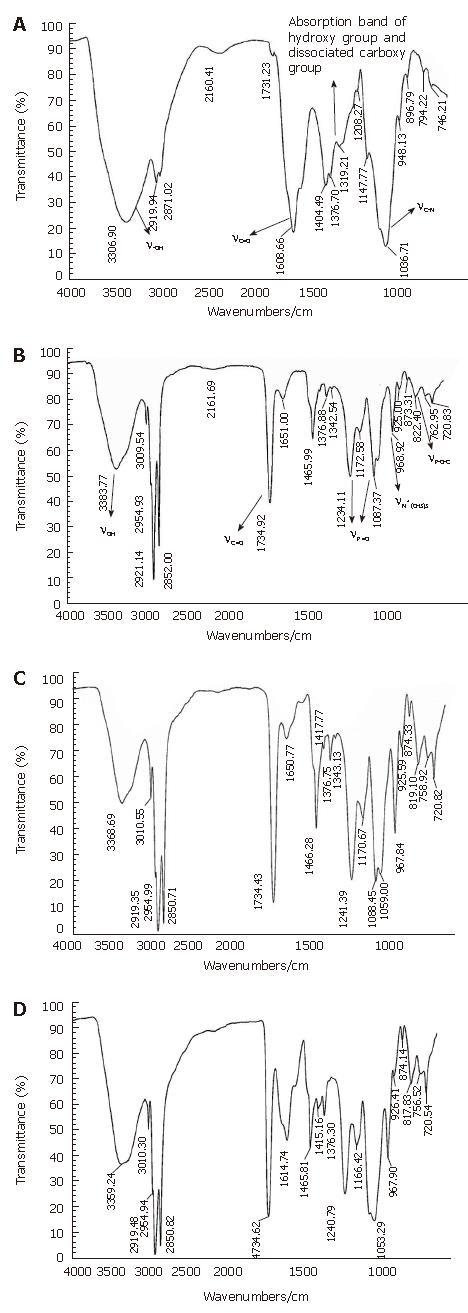
Figure 1 The IR spectra of HA, PL, Haplex, physical mixture of HA and PL.
A: HA; B: PL; C: Mixture of HA and PL; D: Haplex.
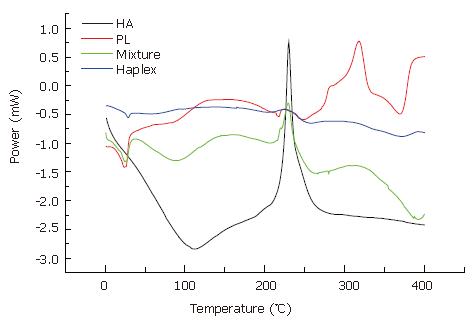
Figure 2 DSC curves of HA, PL, Haplex, physical mixture of HA and PL.
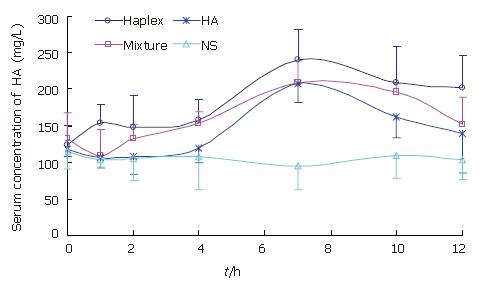
Figure 3 Serum concentration-time curves of HA after single oral dose of Haplex (n = 8).
- Citation: Huang SL, Ling PX, Zhang TM. Oral absorption of hyaluronic acid and phospholipids complexes in rats. World J Gastroenterol 2007; 13(6): 945-949
- URL: https://www.wjgnet.com/1007-9327/full/v13/i6/945.htm
- DOI: https://dx.doi.org/10.3748/wjg.v13.i6.945


