Copyright
©2007 Baishideng Publishing Group Co.
World J Gastroenterol. Dec 28, 2007; 13(48): 6512-6517
Published online Dec 28, 2007. doi: 10.3748/wjg.v13.i48.6512
Published online Dec 28, 2007. doi: 10.3748/wjg.v13.i48.6512
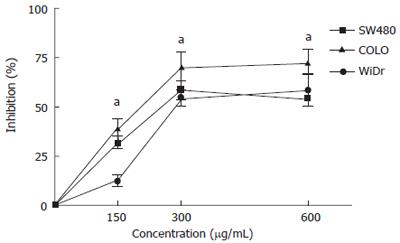
Figure 1 Dose-dependent inhibition of colon cancer cell growth by MK615.
Growth inhibition was evaluated by MTT assay. The percentage inhibition (Y axis) was calculated using the ratio of absorbance at each drug concentration relative to absorbance in absence of the drugs. aP < 0.05.
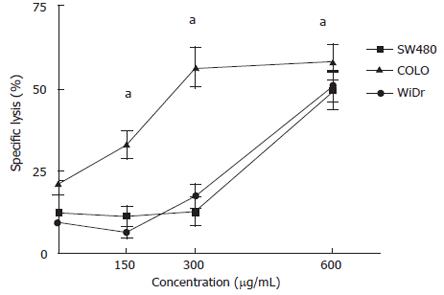
Figure 2 Dose-dependent lysis of colon cancer cells by MK615.
Cells were challenged with 150, 300 or 600 μg/mL MK615. All three colon cancer cell lines were lysed effectively in a dose-dependent manner. aP < 0.05.
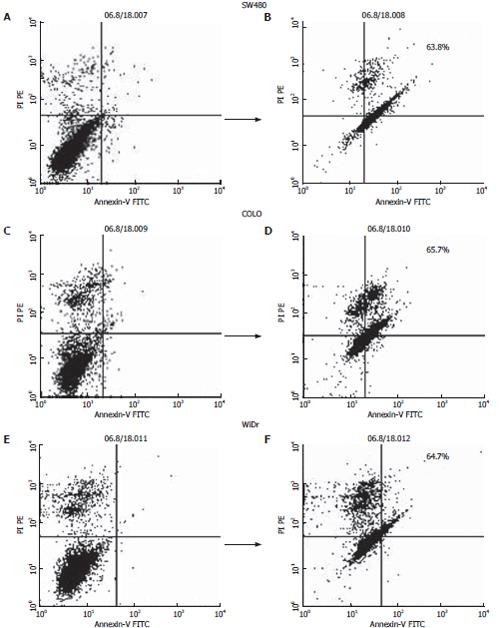
Figure 3 MK615-induced apoptosis in colon cancer cell lines.
SW480, COLO and WiDr cells were cultured without (A, C and E) and with (B, D and F) MK615 at 300 mL, and harvested after 6 h incubation.
Figure 4 Massive induction of cytoplasmic vacuoles by MK615.
MK615 (300 μg/mL) induced cytoplasmic vacuoles in SW480 (A), COLO (B) and WiDr (C) after 6 h incubation.
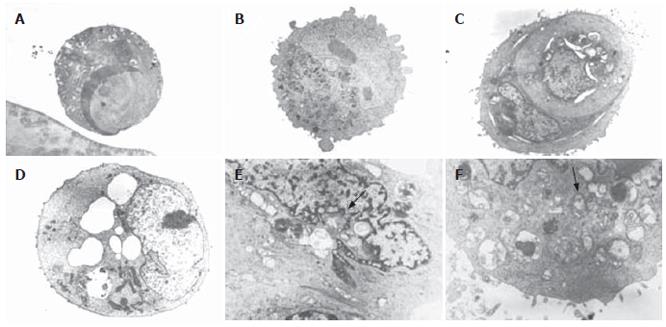
Figure 5 Electron micrographs of autophagy induced by MK615.
A: MK615 induced typical features of apoptosis in SW480 cells; B-F: Autophagy induced by MK615. Cytoplasmic vacuoles (autophagosomes) induced by MK615 in SW480 B and C, COLO D and E and WiDr (F) cells. Degenerated mitochondria are evident (arrows in E and F).
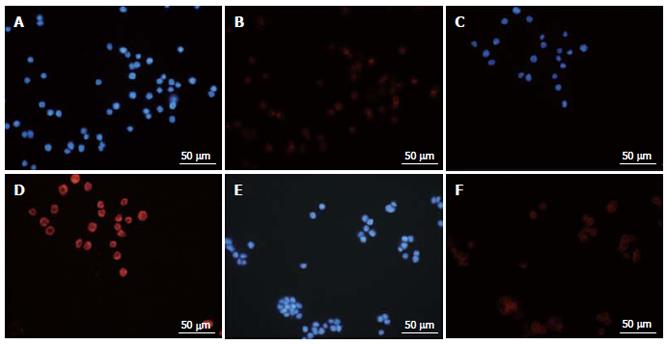
Figure 6 Immunofluorescence staining with Atg8 (LC3).
SW480 (A), COLO (B) and WiDr (C) cells were cultured with MK615 at 300 μg/mL for 6 h. Nuclei were stained with DAPI (A, C and E), and Atg8 (LC3) was localized in the cytoplasm (B, D and F; note the central blank area in the cells).
-
Citation: Mori S, Sawada T, Okada T, Ohsawa T, Adachi M, Keiichi K. New anti-proliferative agent, MK615, from Japanese apricot “
Prunus mume ” induces striking autophagy in colon cancer cellsin vitro . World J Gastroenterol 2007; 13(48): 6512-6517 - URL: https://www.wjgnet.com/1007-9327/full/v13/i48/6512.htm
- DOI: https://dx.doi.org/10.3748/wjg.v13.i48.6512


