Copyright
©2007 Baishideng Publishing Group Inc.
World J Gastroenterol. Nov 14, 2007; 13(42): 5605-5611
Published online Nov 14, 2007. doi: 10.3748/wjg.v13.i42.5605
Published online Nov 14, 2007. doi: 10.3748/wjg.v13.i42.5605
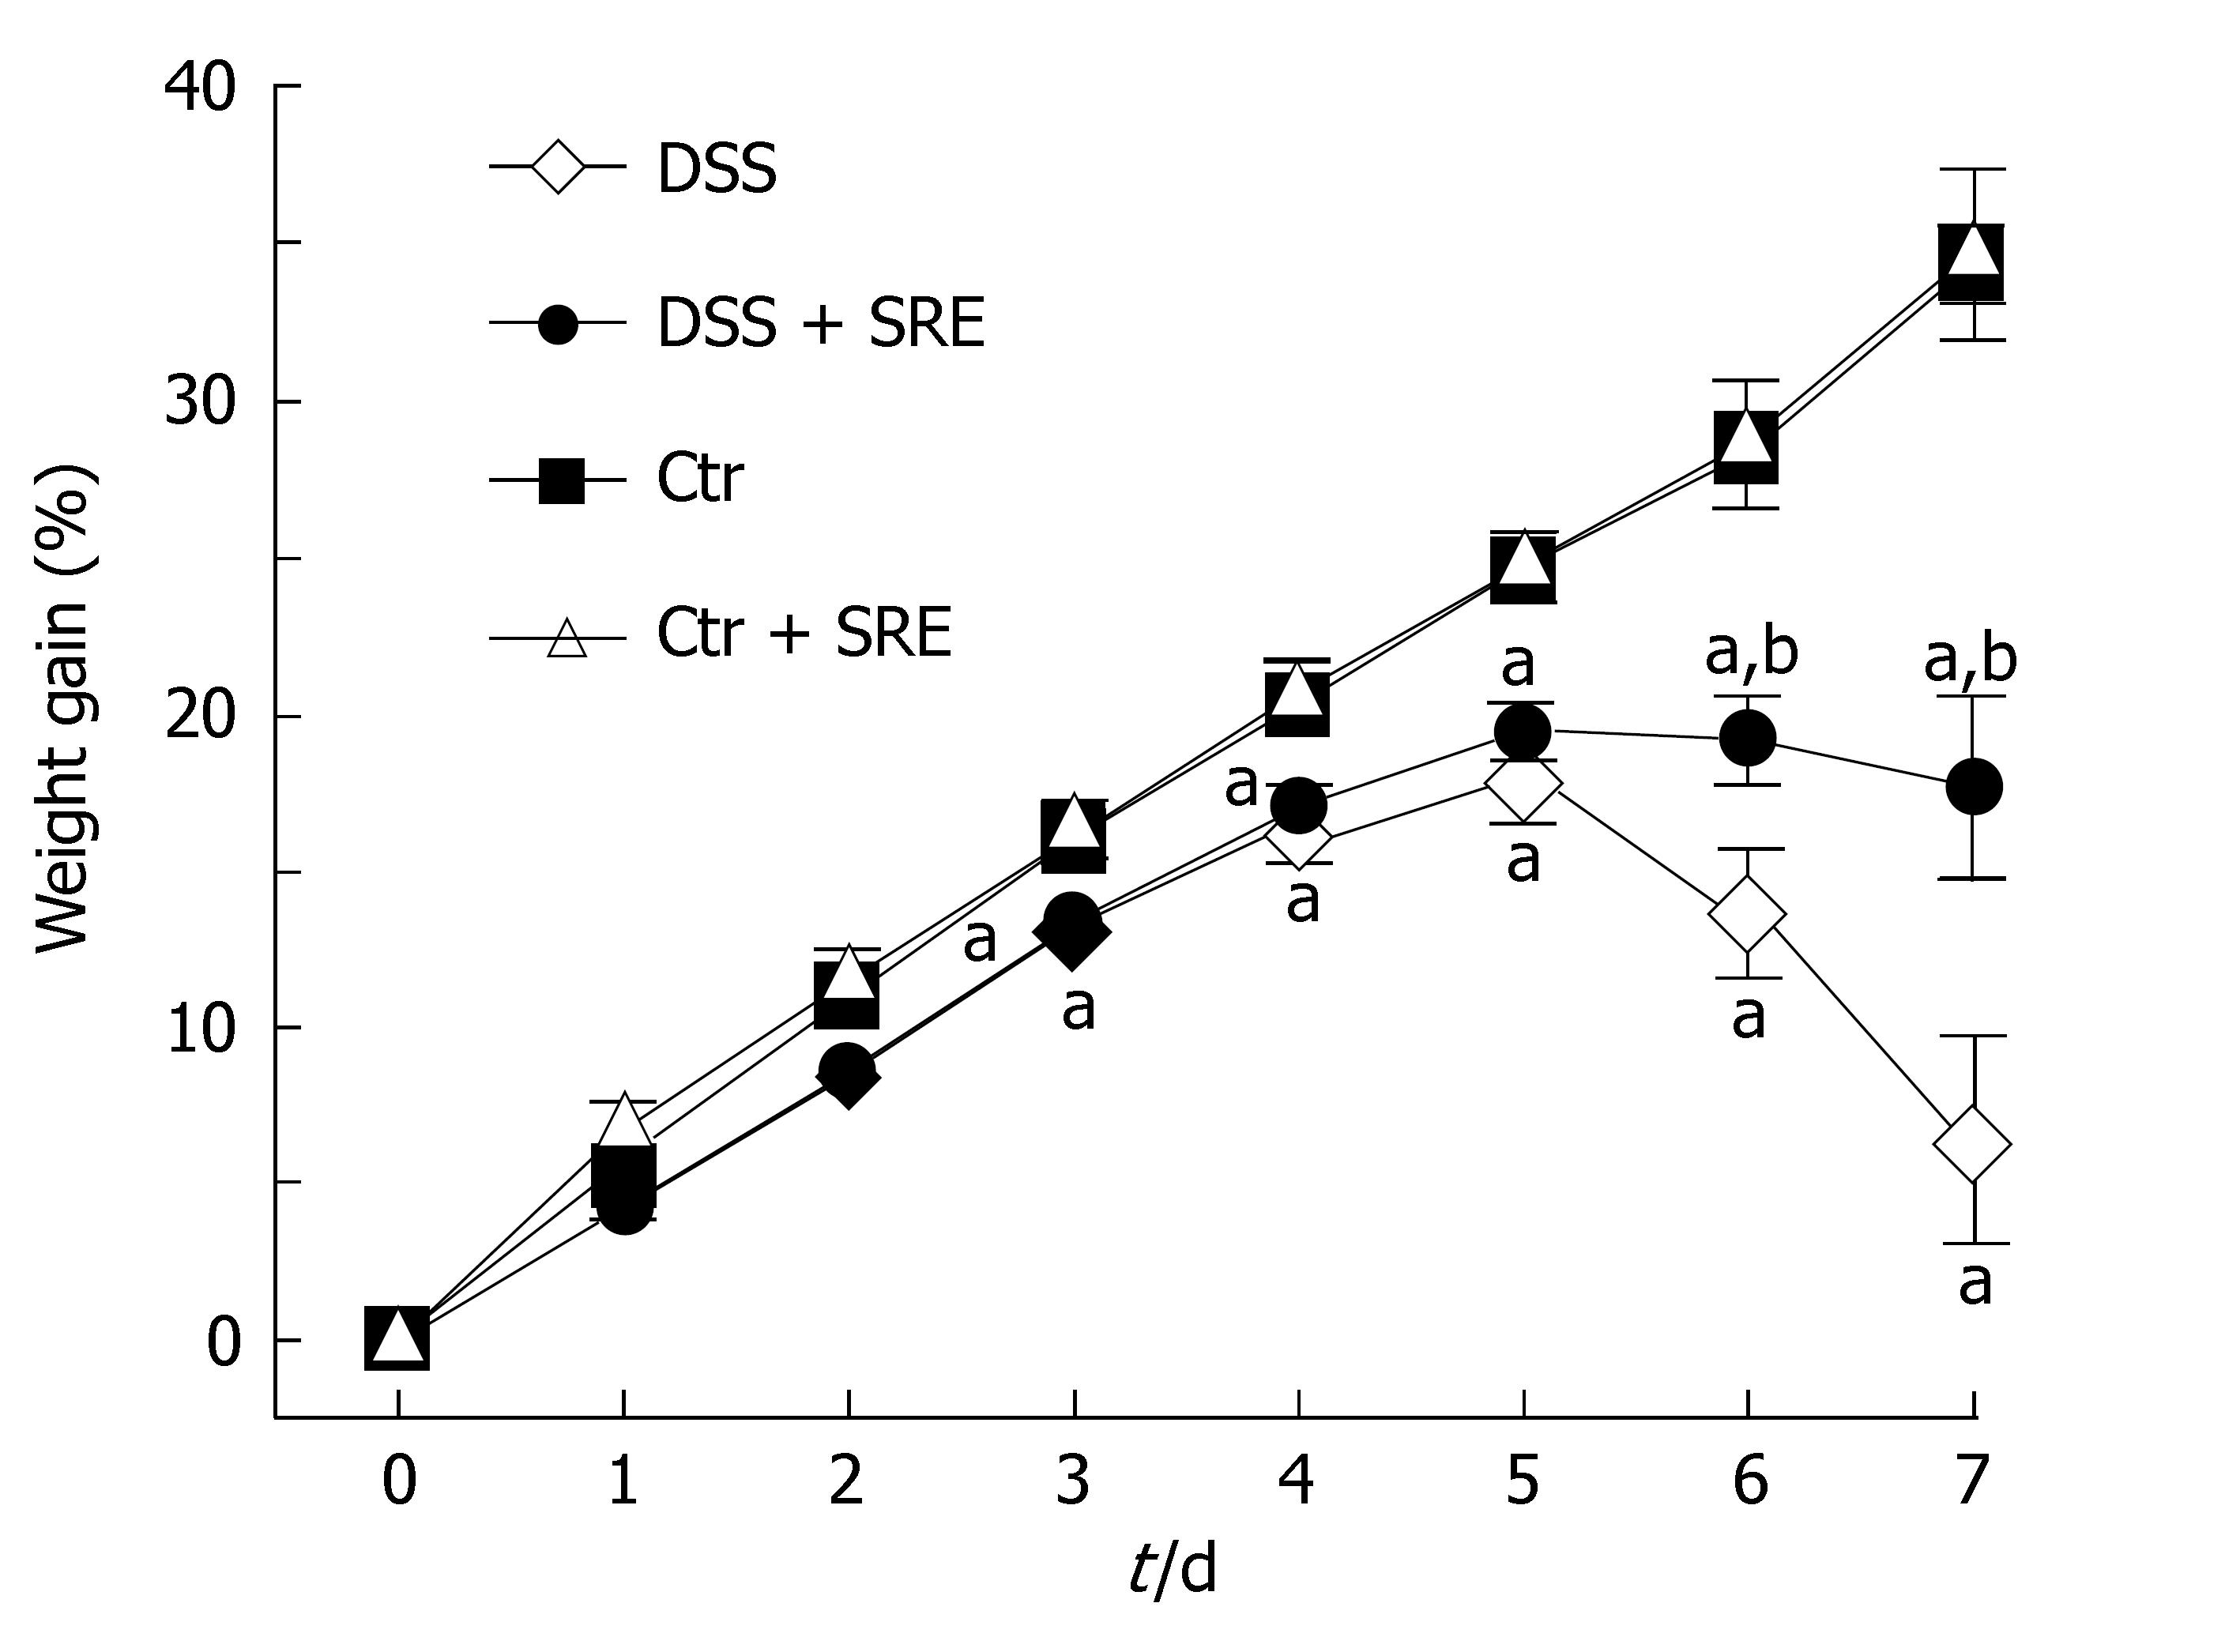
Figure 1 Figure showing the weight gain percentage (%) in different groups of rat from d 0 to d 7.
Body weight was assessed daily and expressed as percentage increase of basal body weight. Values are expressed as the means ± SE, (n = 8), aP < 0.05 vs Ctr group, bP < 0.05 vs DSS group, one-way ANOVA followed by Tukey multiple comparison test.
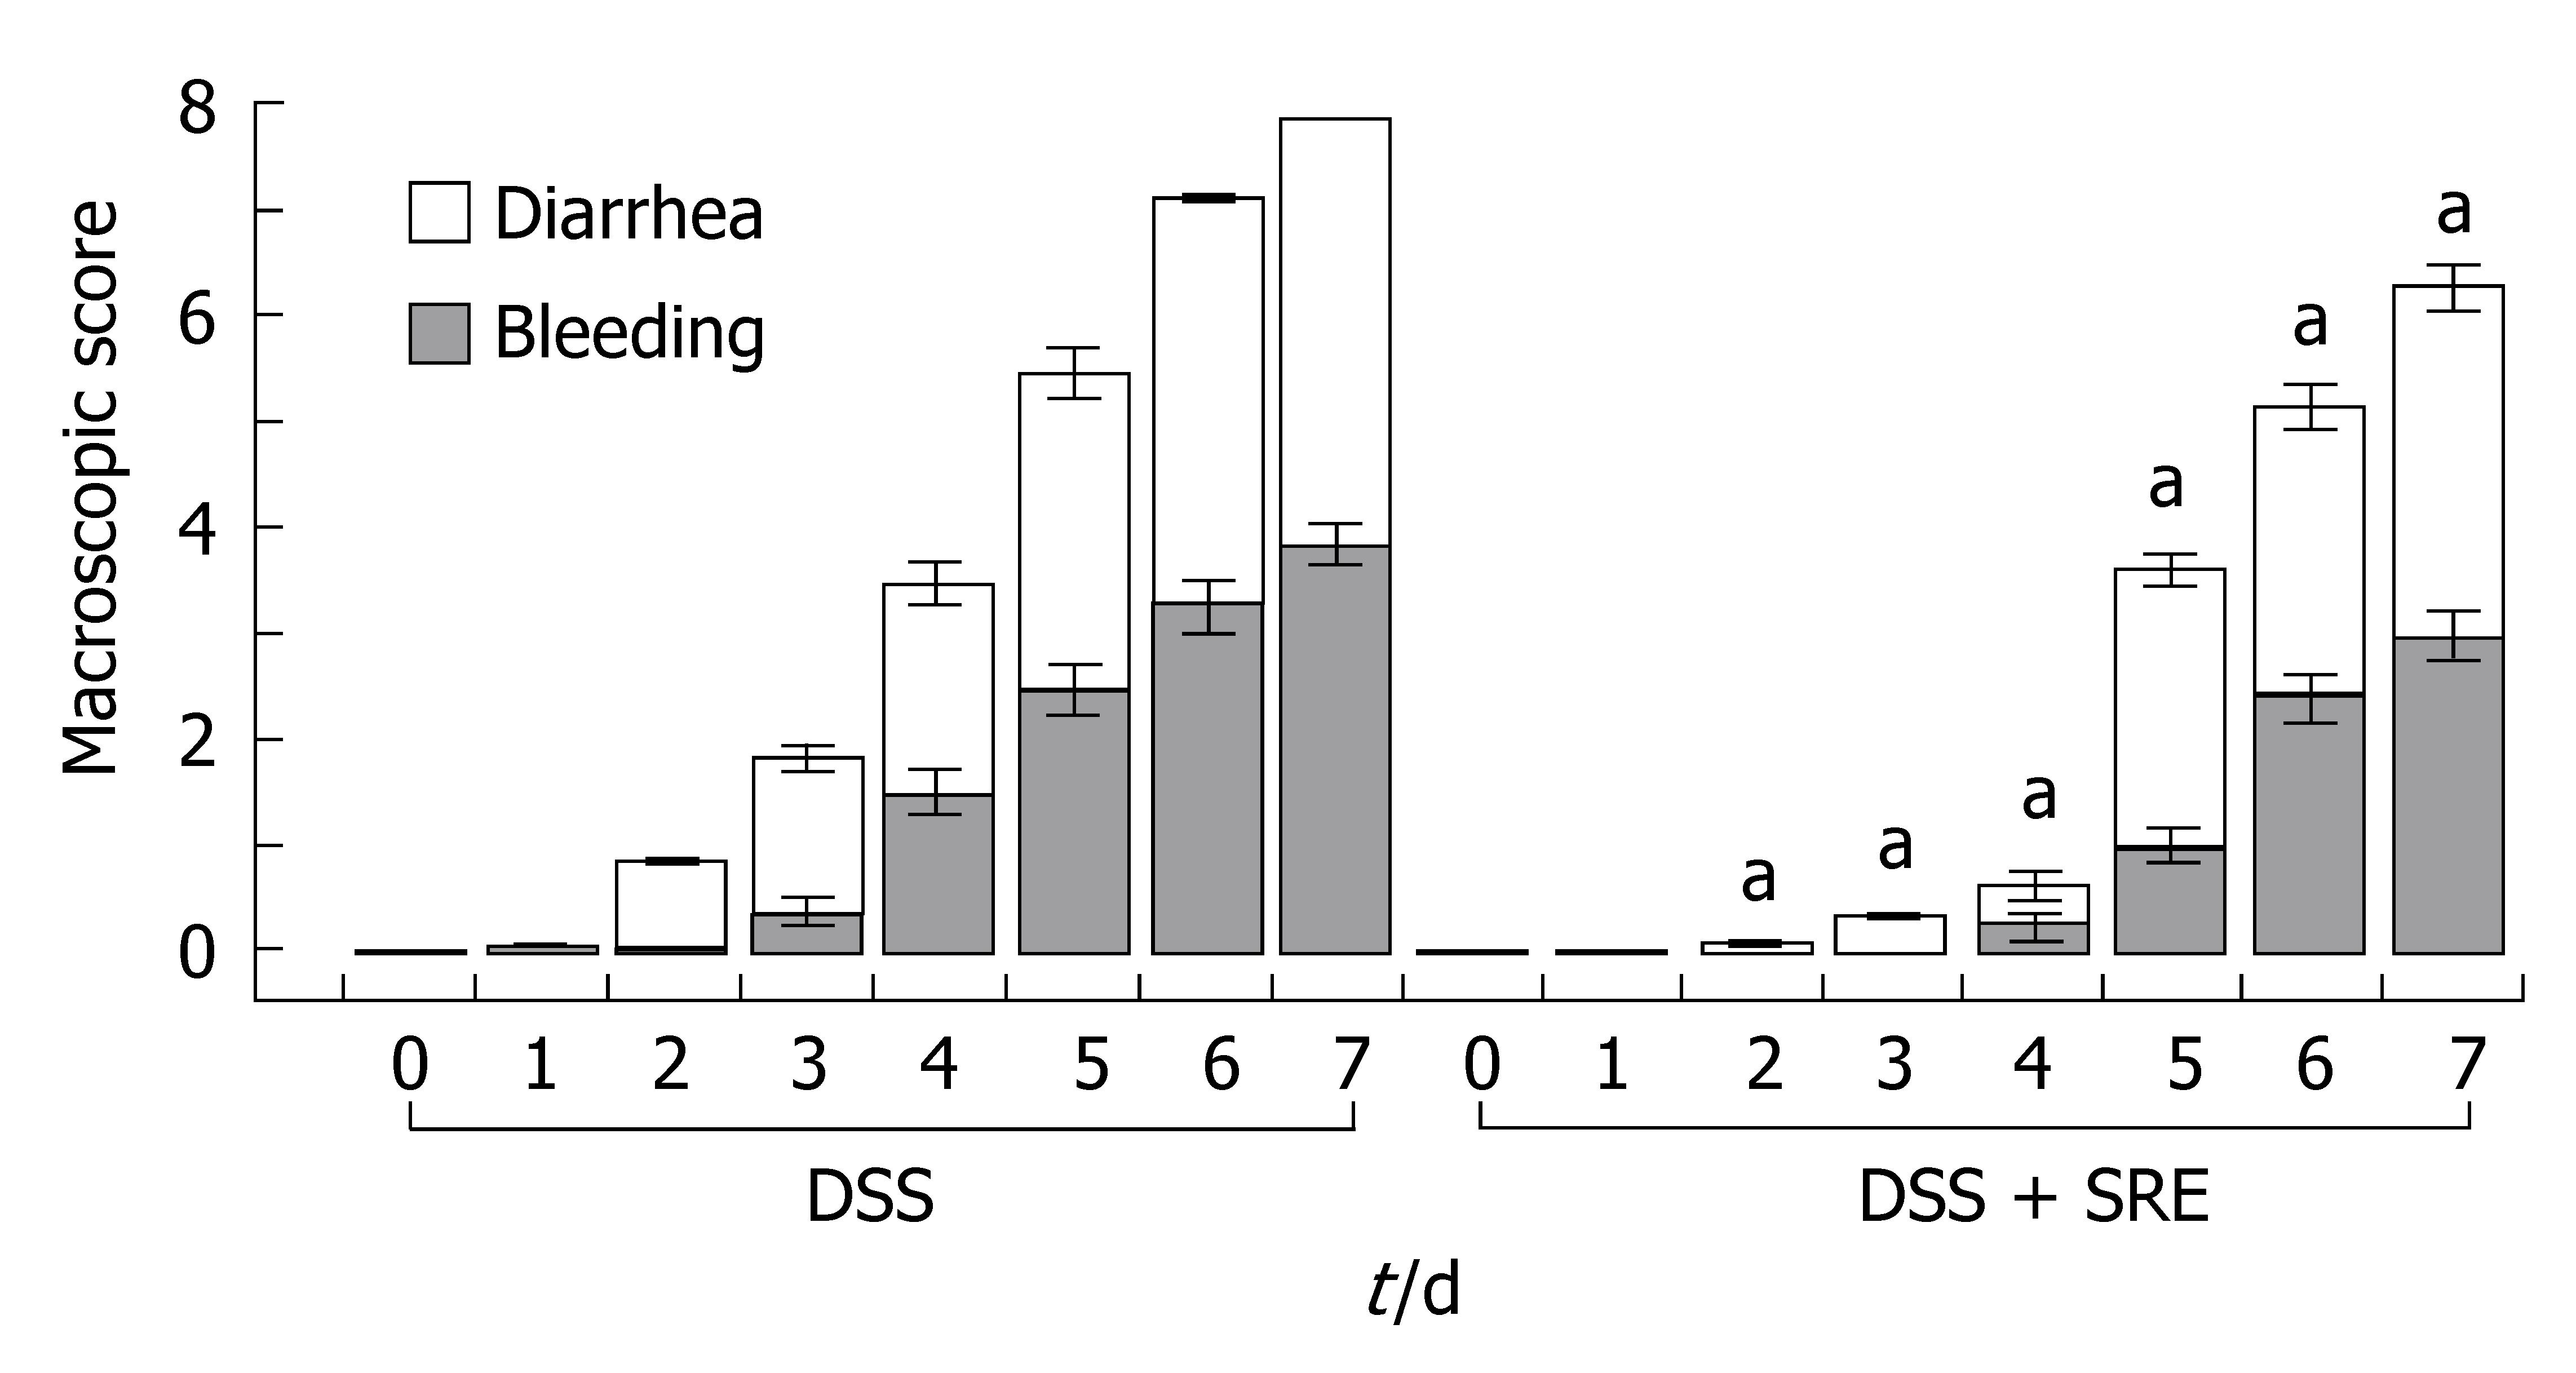
Figure 2 Ameliorative effect of SRE treatment on the time-course changes in the macroscopic score over the 8-d experimental period.
The macroscopic score of Ctr and Ctr + SRE groups is 0 (data not shown). aP < 0.05 vs DSS group. Non-parametric data are expressed as the means ± SE, Kruskal-Wallis One Way Analysis using Student-Newman-Keuls method (n = 6-8).
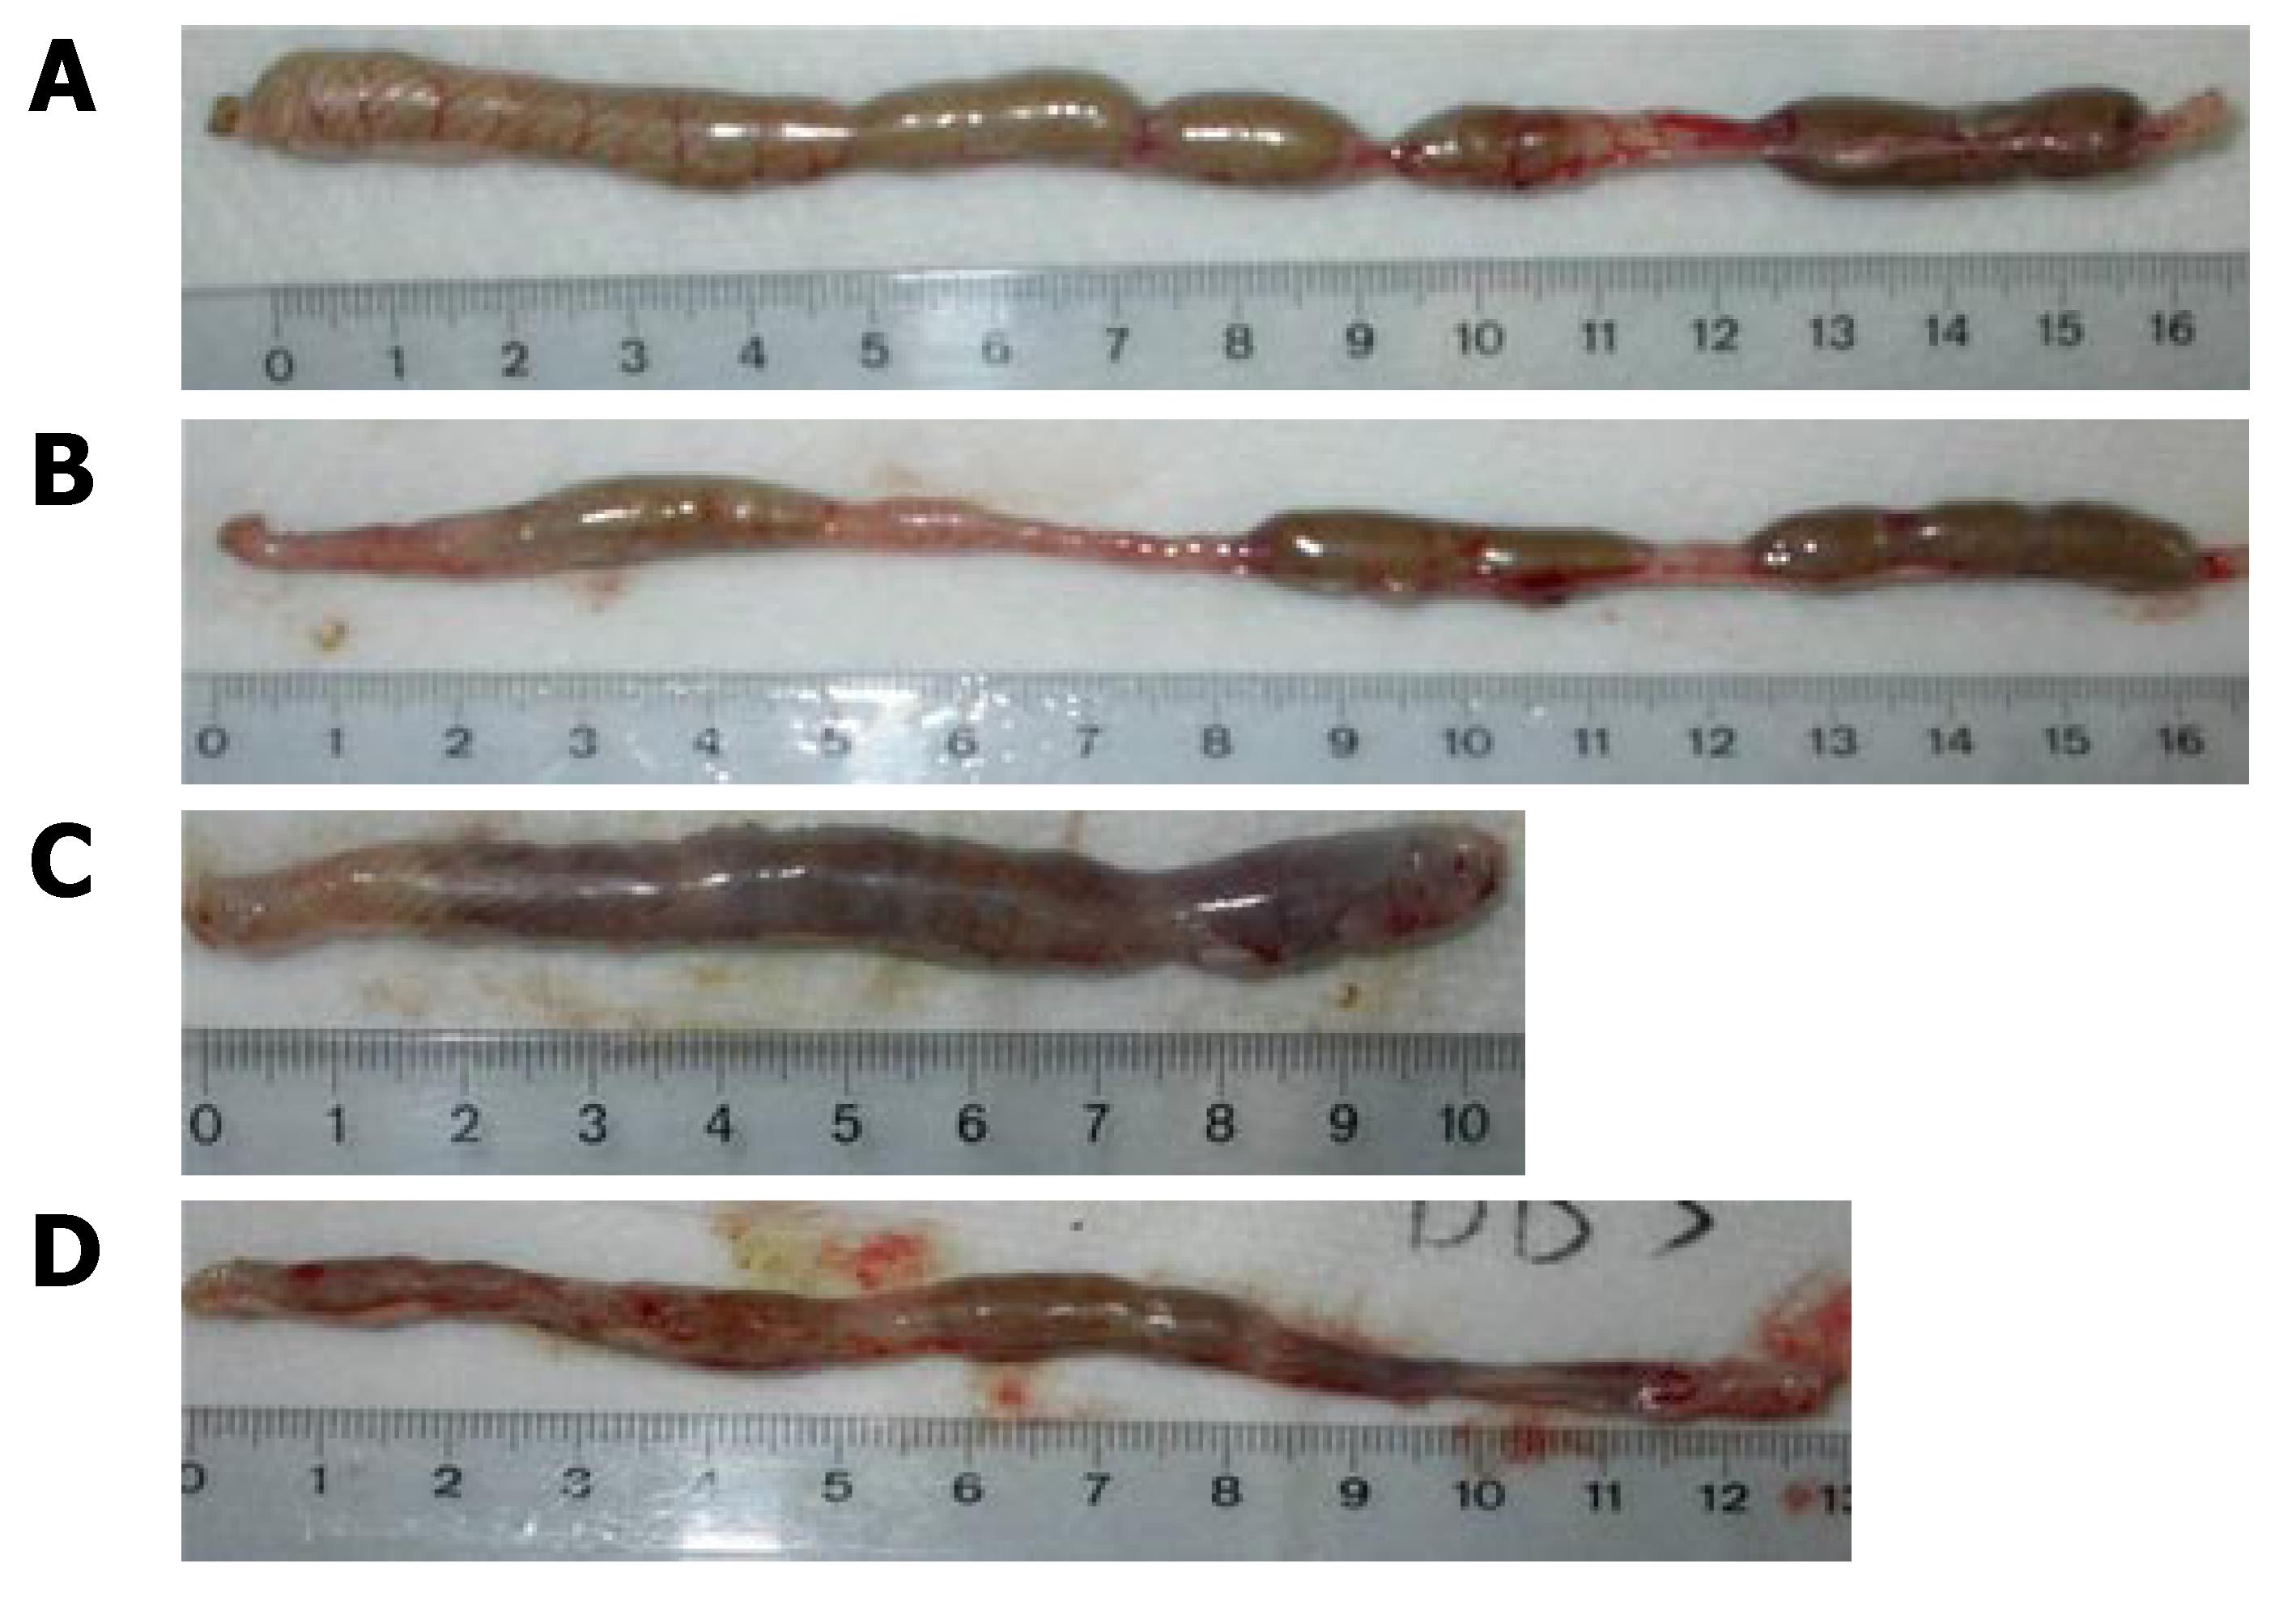
Figure 3 Macroscopic view of the colon showing the changes in colon length in different groups of rat on d 7.
Not much difference was observed between the colon of the Ctr (A) and Ctr + SRE group (B), but significant difference could be found in the DSS group (C) which displayed extensive hyperemia and edema. In the DSS + SRE group, the shortening of colon was less severe (D) when compared with the control (A).
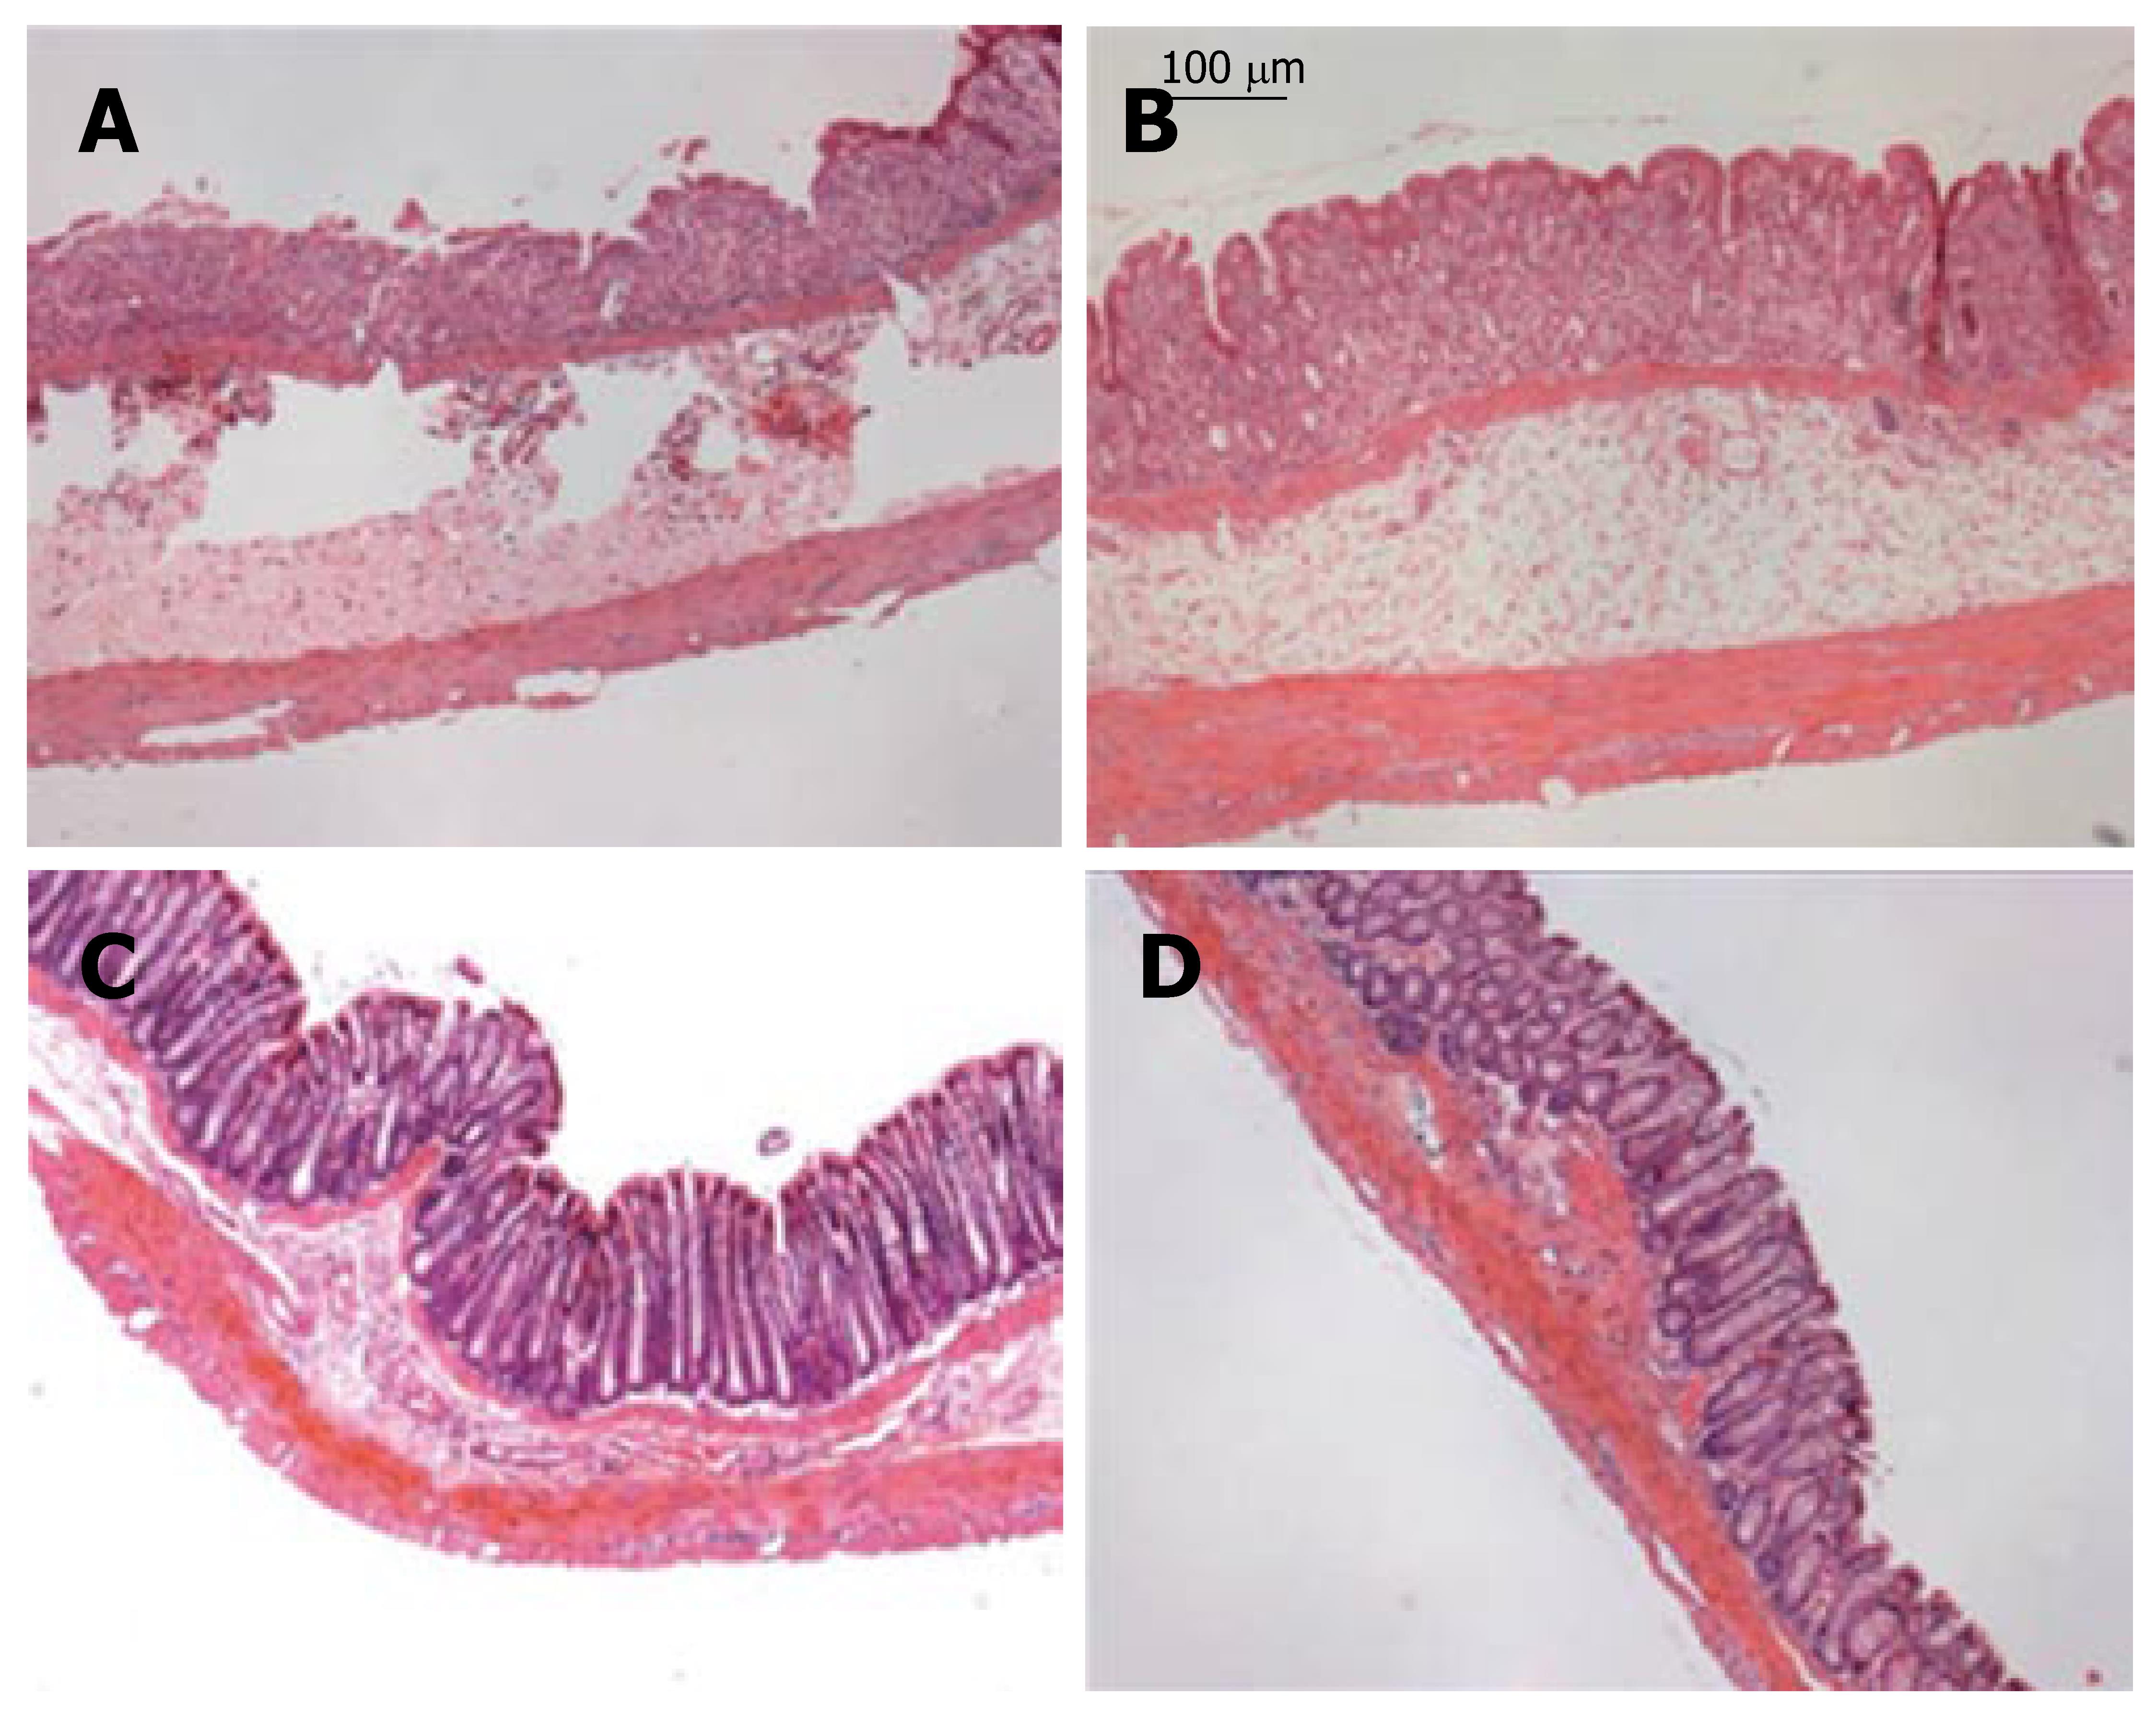
Figure 4 Histological sections from different groups of rats on d 7.
A: DSS group showing extensive ulceration with a severe inflammatory cell infiltrate; B: DSS + SRE group showing recovery in the inflammatory cell infiltration with less severe ulceration; C: Non-colitic Ctr group showing the normal histology of the colon; D: Ctr + SRE group showing the normal morphology of the colon. (HE staining; original magnifications, x 100).
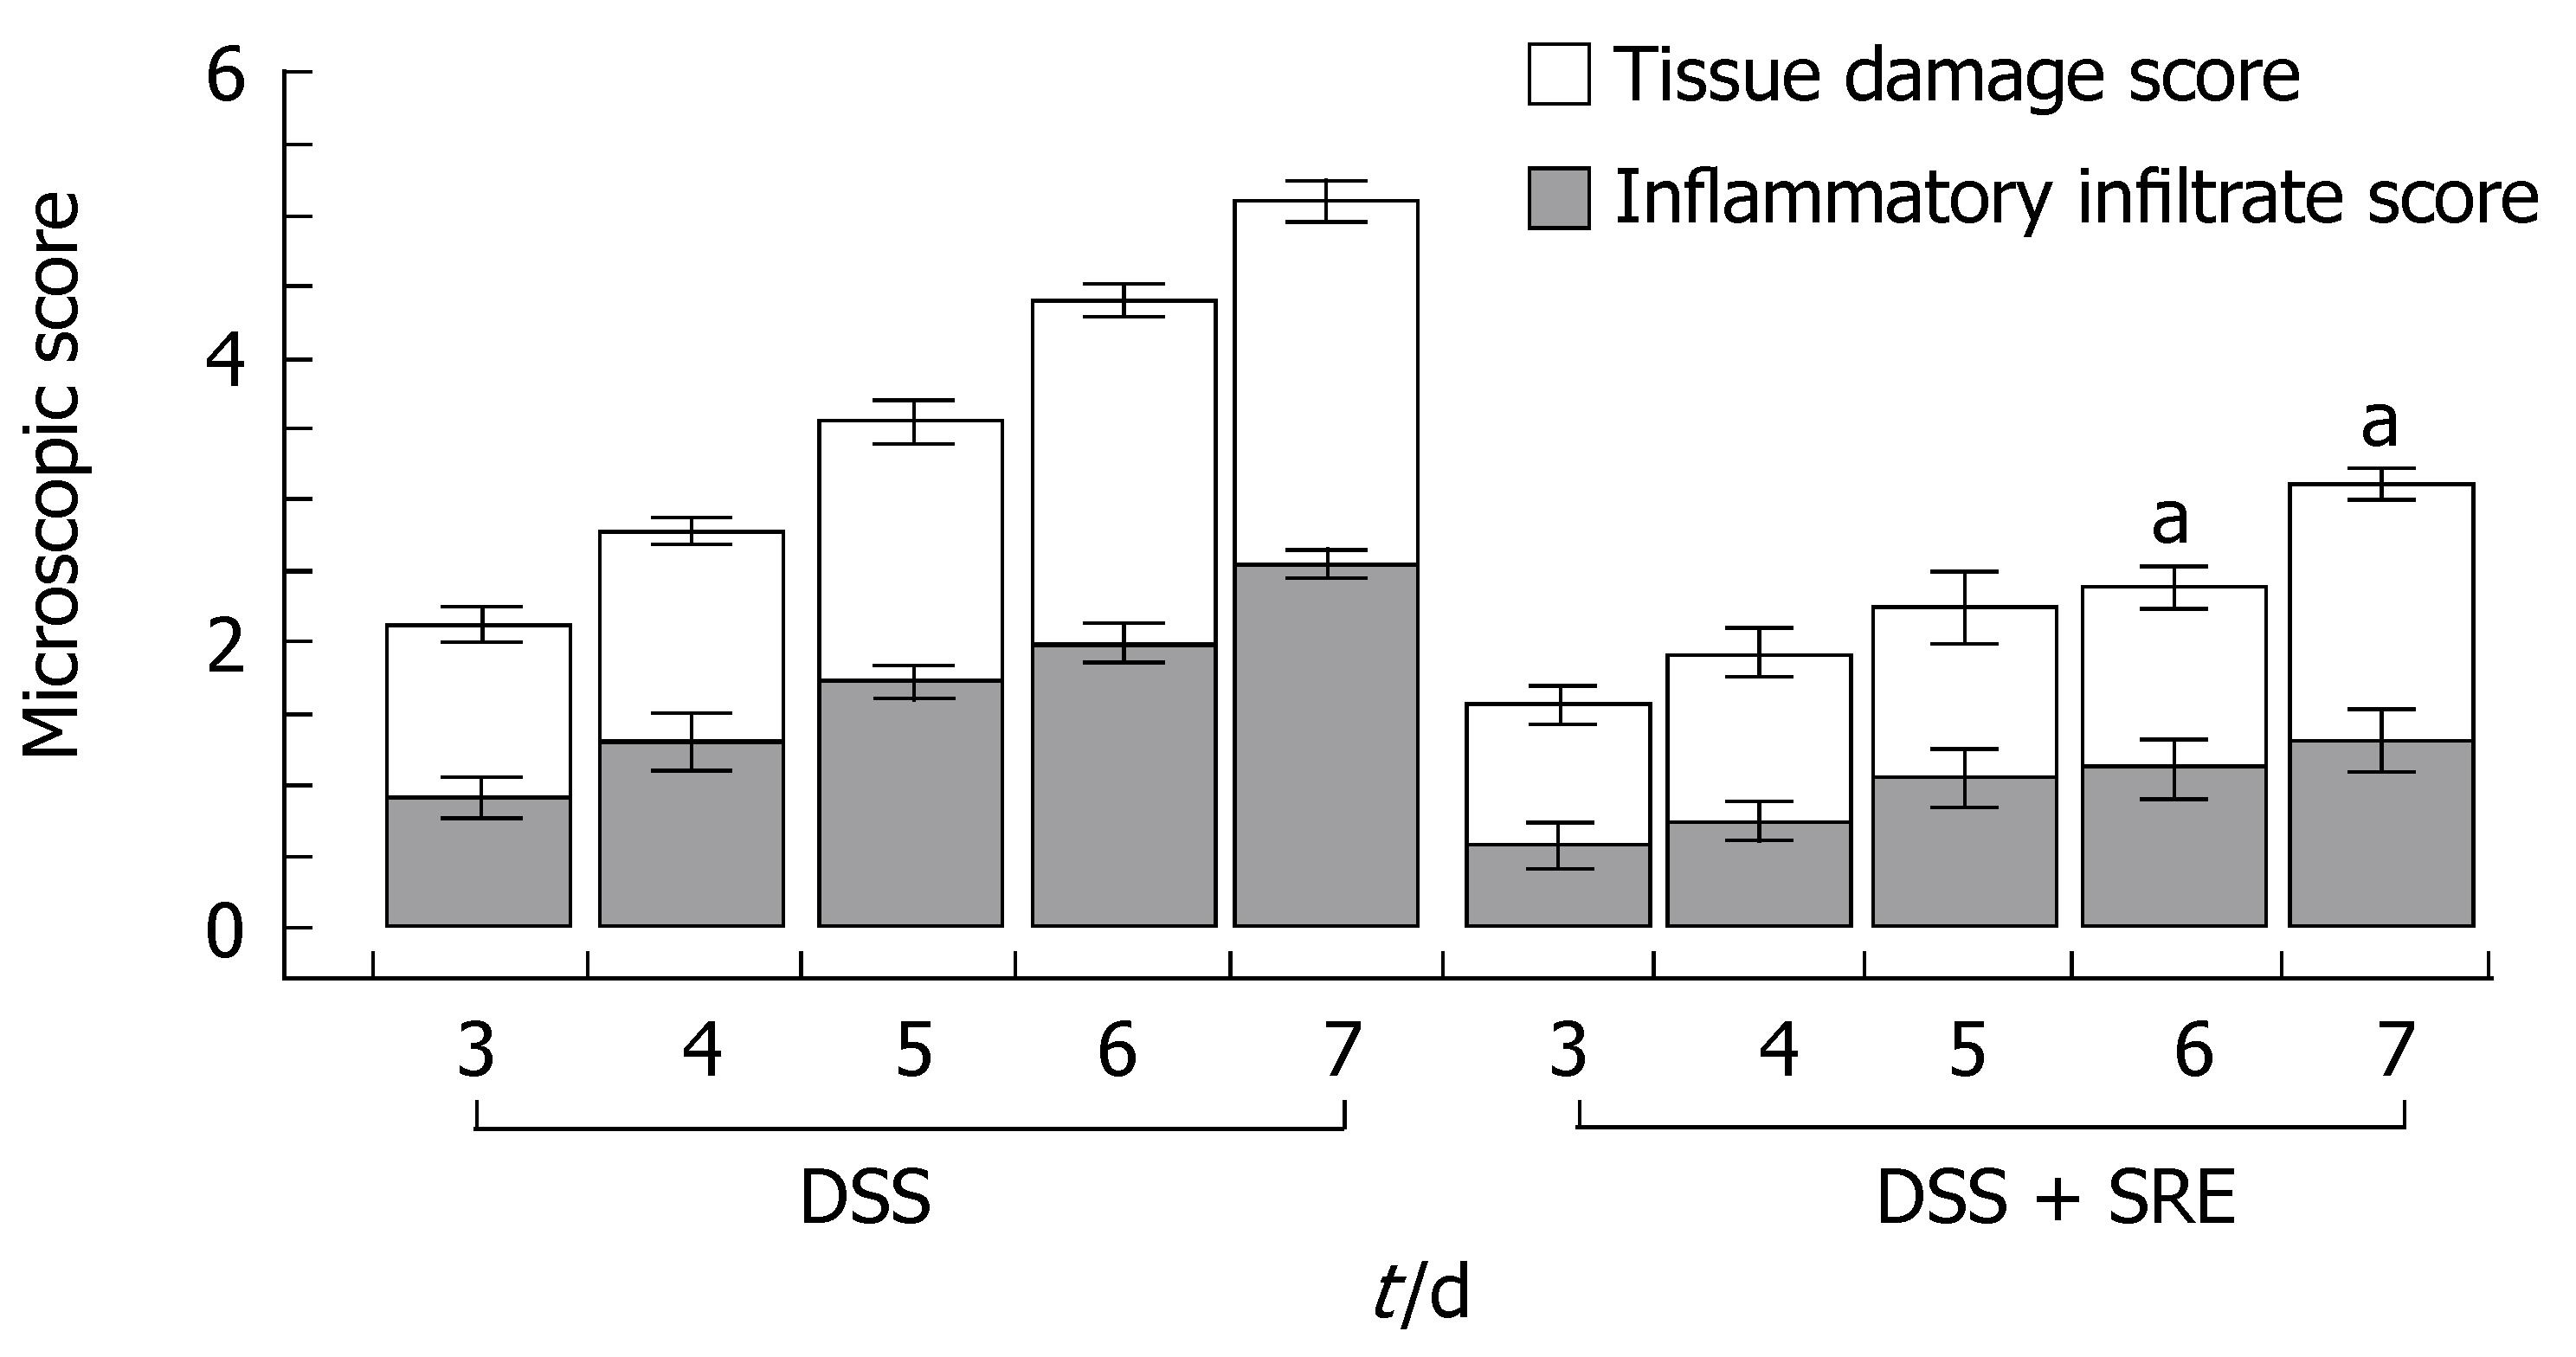
Figure 5 Ameliorative effect of SRE treatment on the time-course changes in the microscopic score from d 3 to d 7.
The microscopic score of Ctr and Ctr + SRE groups is 0 (data not shown). aP < 0.05 vs DSS group. Non-parametric data are expressed as the means ± SE, Kruskal-Wallis One Way Analysis using Student-Newman-Keuls method (n = 4-5).
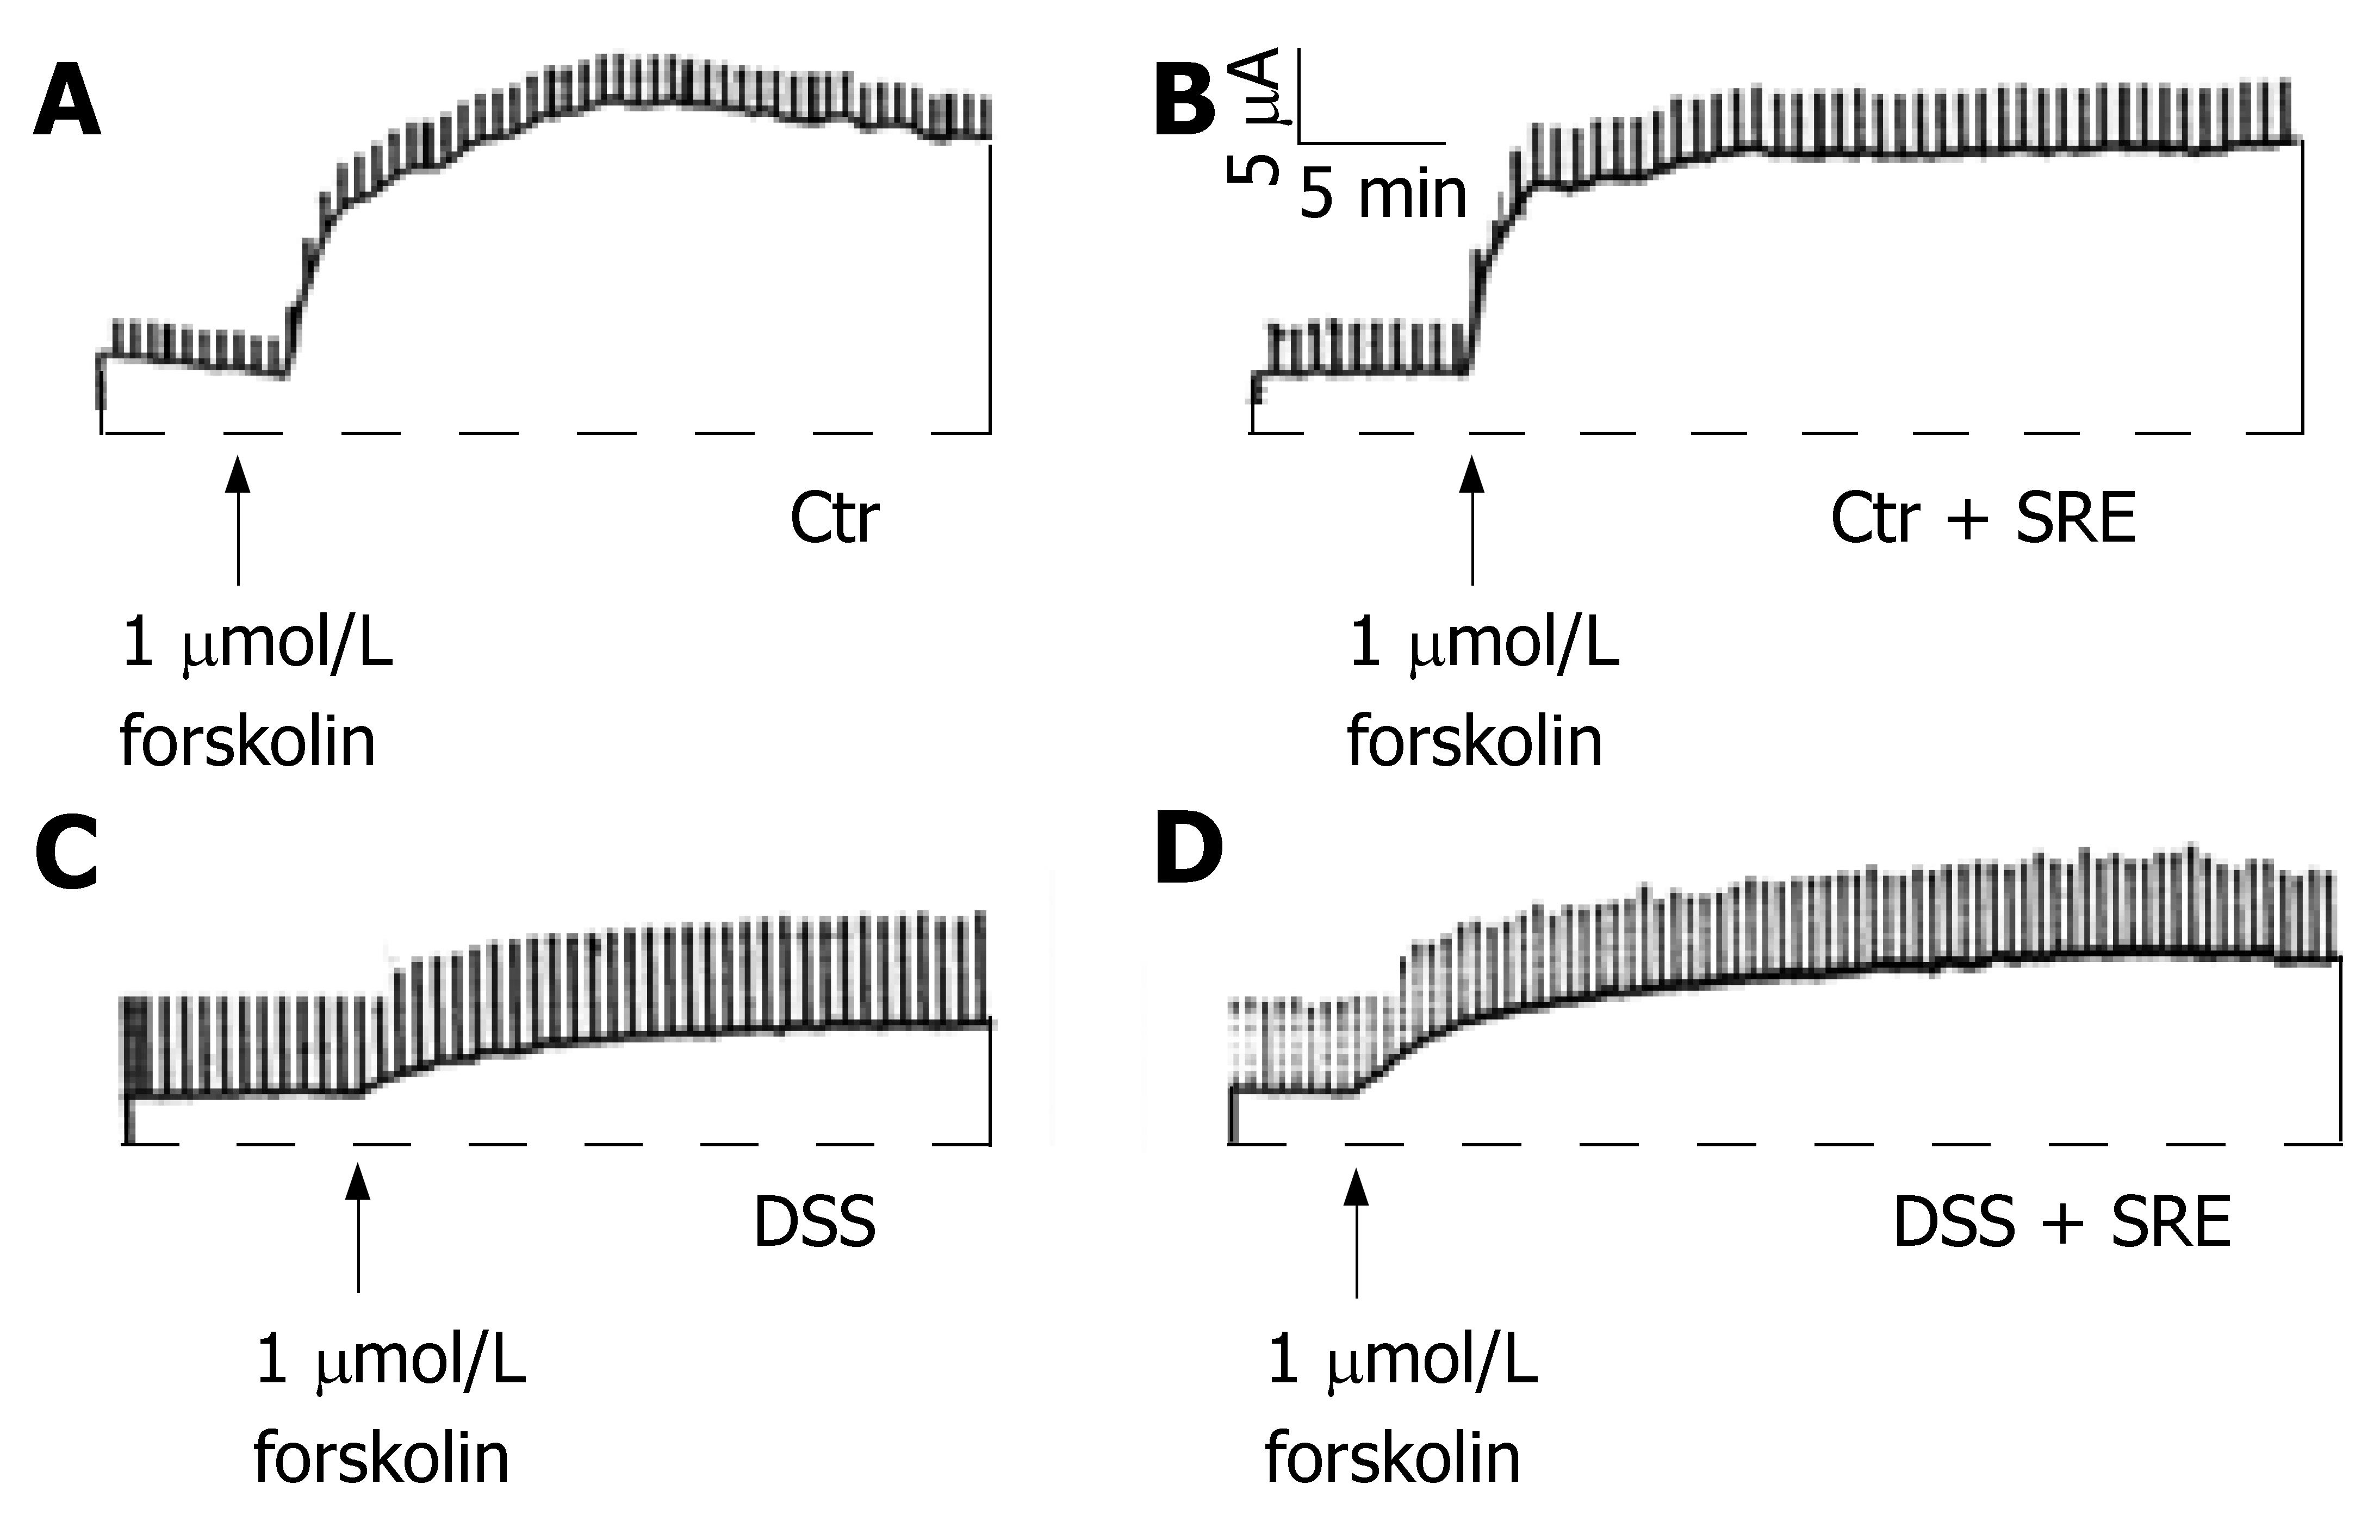
Figure 6 Representative tracings showing the change in ISC evoked by forskolin in different groups of rat on d 7.
All four groups showed an increase in ISC but with different magnitudes (A-D). The ISC response was greatly reduced in the DSS group (C) when compared with the control (A). On the other hand, the reduction in secretory response appears to be ameliorated in the DSS + SRE group (D). The transient current pulses were the results of intermittently clamping the potential at 1 mV. The horizontal lines represent zero ISC. The record is representative of at least six experiments.
-
Citation: Chung HL, Yue GGL, To KF, Su YL, Huang Y, Ko WH. Effect of
Scutellariae Radix extract on experimental dextran-sulfate sodium-induced colitis in rats. World J Gastroenterol 2007; 13(42): 5605-5611 - URL: https://www.wjgnet.com/1007-9327/full/v13/i42/5605.htm
- DOI: https://dx.doi.org/10.3748/wjg.v13.i42.5605


