Copyright
©2007 Baishideng Publishing Group Inc.
World J Gastroenterol. Nov 14, 2007; 13(42): 5605-5611
Published online Nov 14, 2007. doi: 10.3748/wjg.v13.i42.5605
Published online Nov 14, 2007. doi: 10.3748/wjg.v13.i42.5605
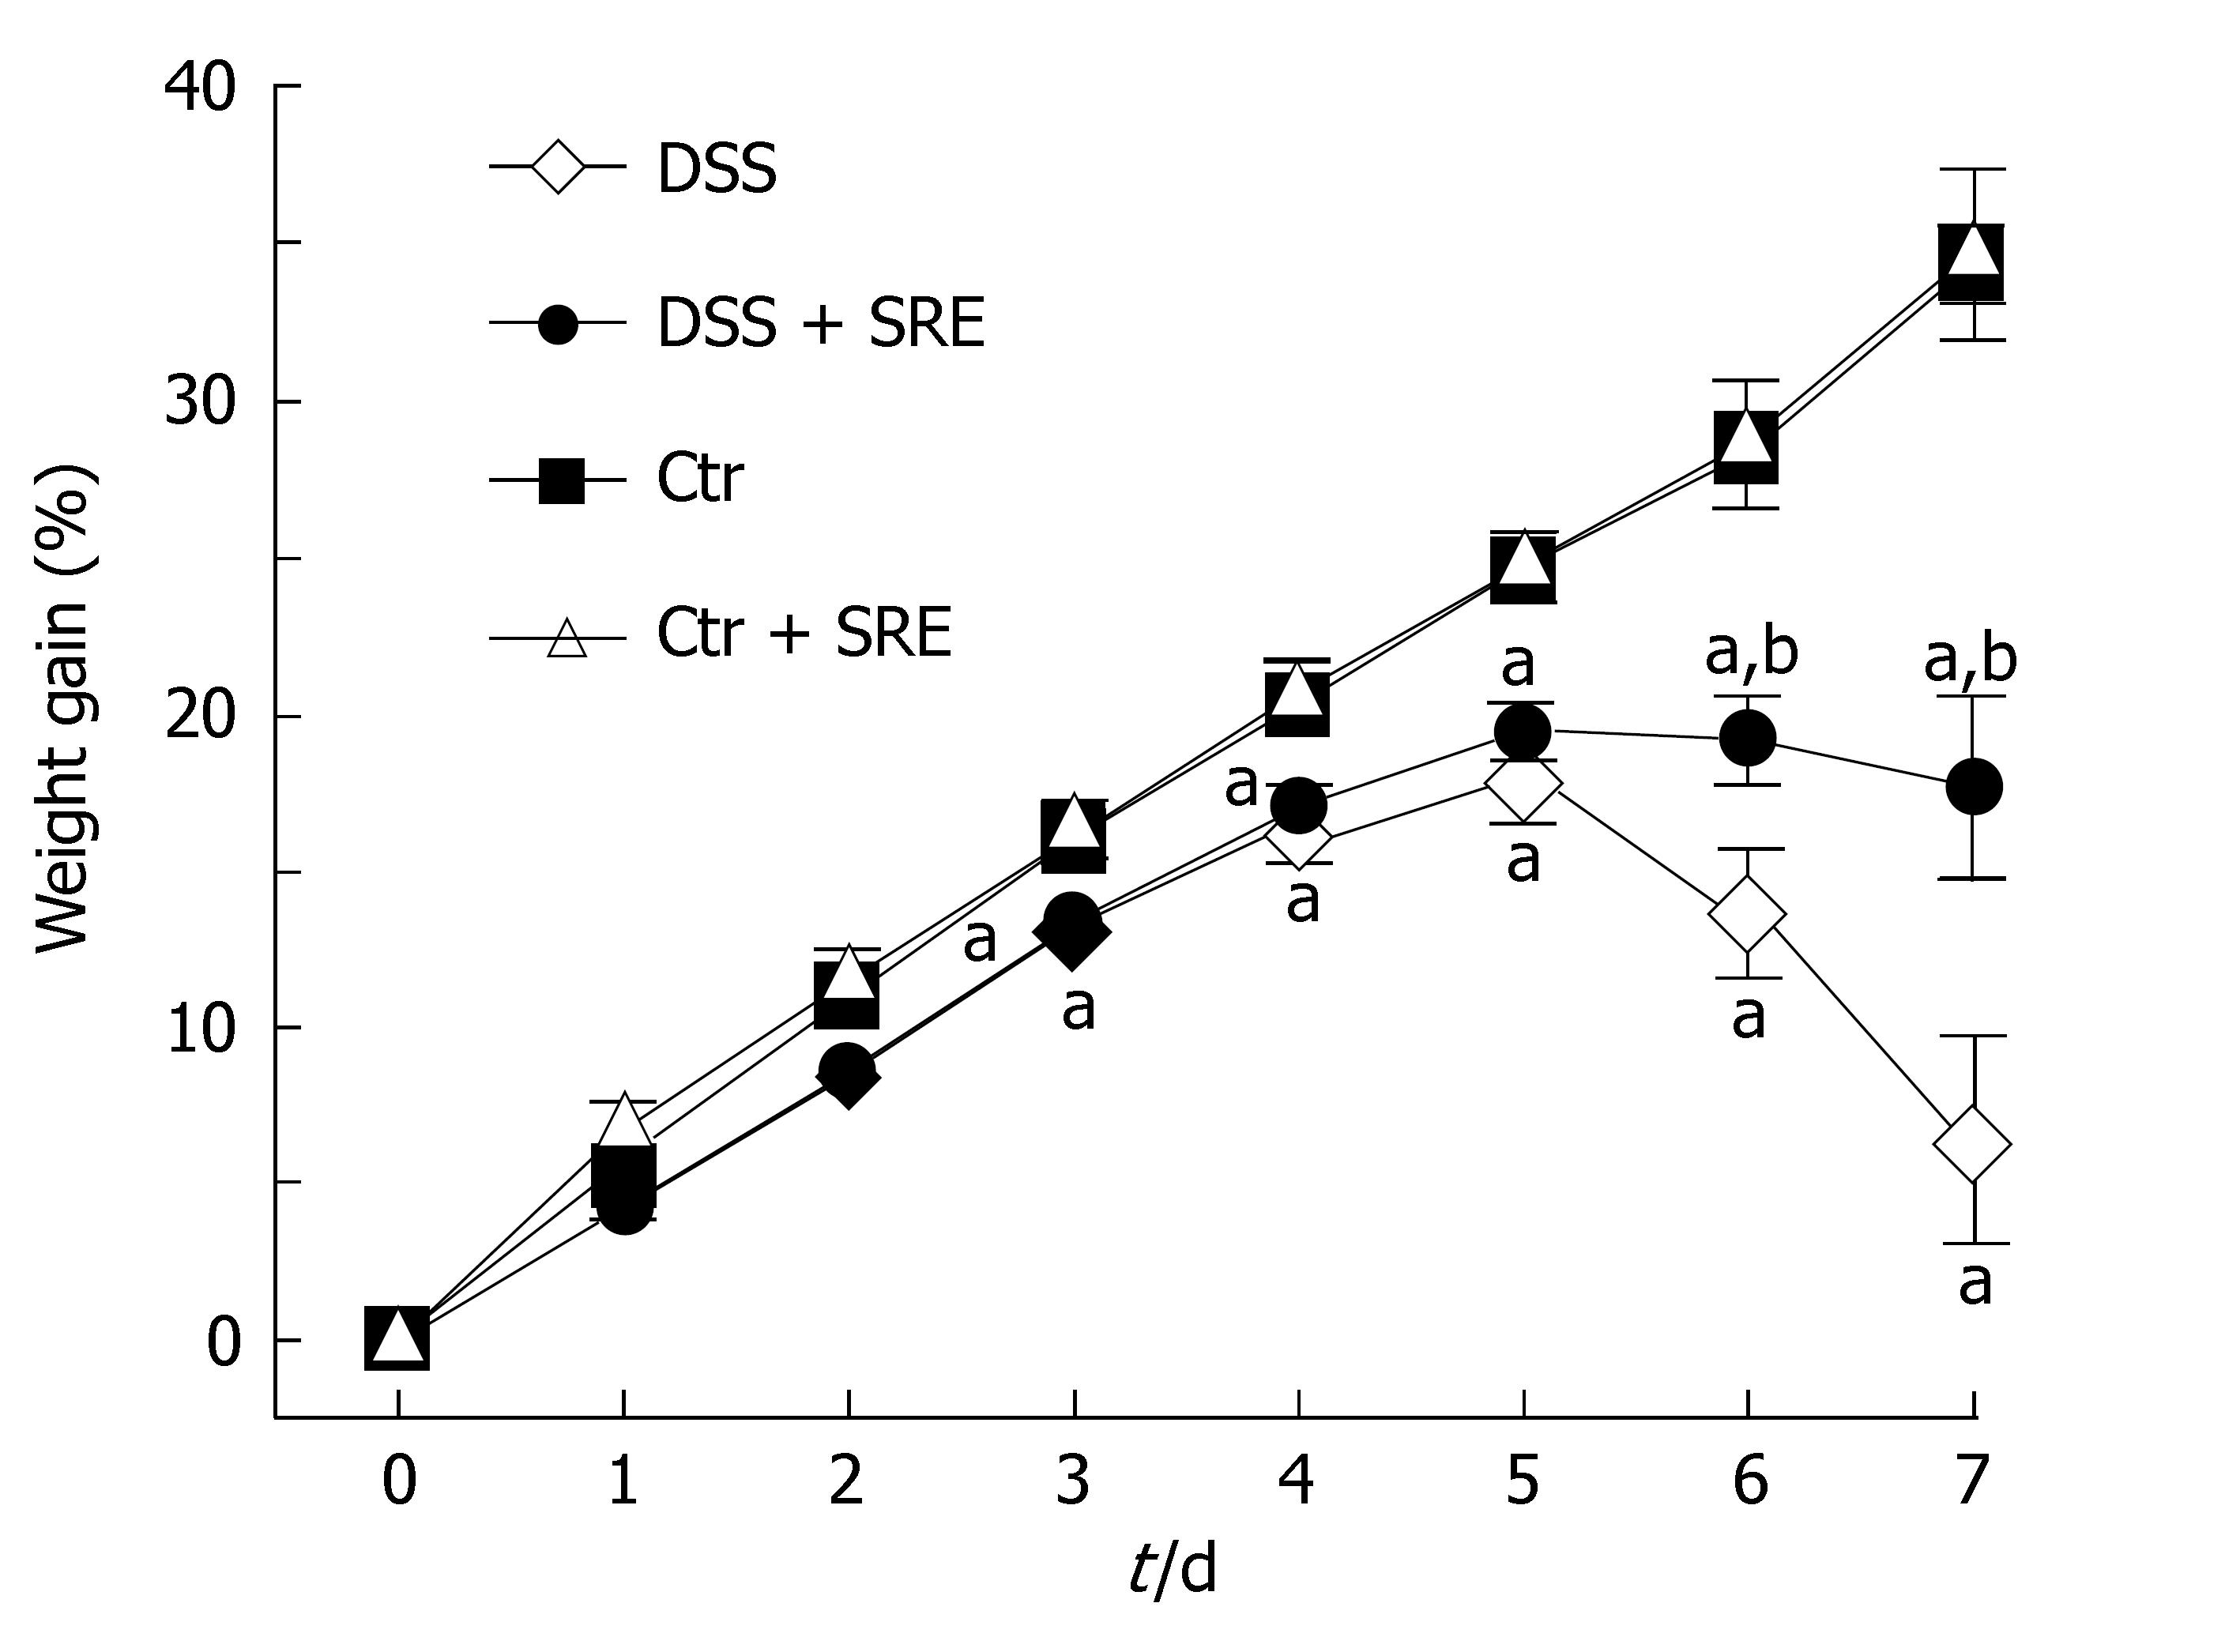
Figure 1 Figure showing the weight gain percentage (%) in different groups of rat from d 0 to d 7.
Body weight was assessed daily and expressed as percentage increase of basal body weight. Values are expressed as the means ± SE, (n = 8), aP < 0.05 vs Ctr group, bP < 0.05 vs DSS group, one-way ANOVA followed by Tukey multiple comparison test.
-
Citation: Chung HL, Yue GGL, To KF, Su YL, Huang Y, Ko WH. Effect of
Scutellariae Radix extract on experimental dextran-sulfate sodium-induced colitis in rats. World J Gastroenterol 2007; 13(42): 5605-5611 - URL: https://www.wjgnet.com/1007-9327/full/v13/i42/5605.htm
- DOI: https://dx.doi.org/10.3748/wjg.v13.i42.5605


