Copyright
©2007 Baishideng Publishing Group Co.
World J Gastroenterol. Jun 7, 2007; 13(21): 2923-2931
Published online Jun 7, 2007. doi: 10.3748/wjg.v13.i21.2923
Published online Jun 7, 2007. doi: 10.3748/wjg.v13.i21.2923
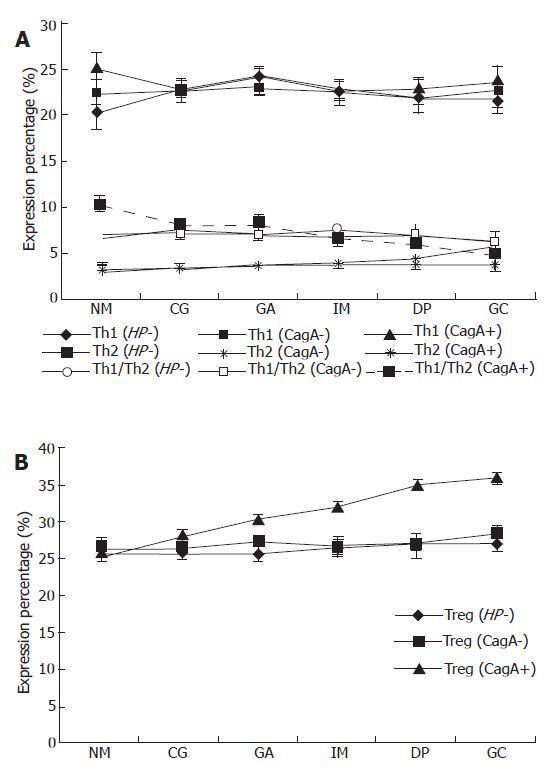
Figure 1 Expression of peripheral blood Th1, Th2 and Th1/Th2 ratio (A) and Treg cells (B) in patients with CagA+ and CagA- H pylori infection and in those without H pylori infection (Hp-) as determined by FCM.
In CagA+ H pylori infected subjects, there is no significant difference in the percentage of Th1 cells in all groups, while the percentage of Th2 cells increases along the progression of gastric pathology, with significant difference between gastric cancer (GC) and chronic gastritis (CG) (P < 0.001), gastric atrophy (GA) (P < 0.001), and intestinal metaplasia (IM) (P < 0.001), respectively. There is a significant difference in the Th1/Th2 ratio between CG and dyspepsia (DP), GC (P = 0.033, P < 0.001), and between GA and GC (P < 0.001) (A). Treg cell expression increases along the progression with significant difference between CG and IM, DP, and GC (P < 0.001, P < 0.001, and P < 0.001, respectively), between GA and DP, and GC (P = 0.002, and P < 0.001, respectively), and between IM and GC (P = 0.012) (B). There is no difference in the expression of Th1, Th2, Treg cells and Th1/Th2 ratio between the subjects with CagA- H pylori infection and those without H pylori infection among all the groups.
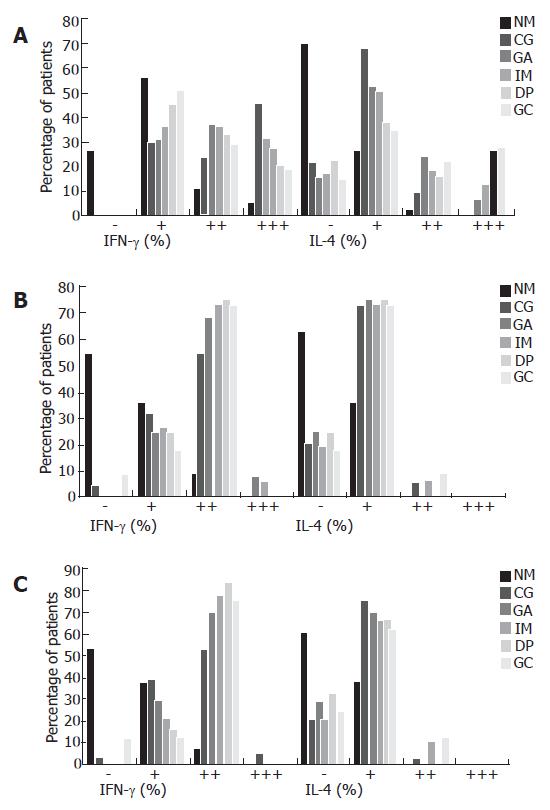
Figure 4 Local immunity responses in patients with CagA+ (A) , CagA- H pylori (B) infection and those without H pylori infection (C) as determined by immunohistochemistry.
Numbers of IFN-γ and IL-4 positive cells from 200 polymorphonuclear cells (PMNs) and mononuclear cells (MNCs) were counted from five randomly chosen fields and averaged. The positive rate was used to grade the expression levels: negative: 0%; +: 1%-25%; ++ 26%-50%; +++, 51%-100%. A: IFN-γ expression with “+++” predominates in chronic gastritis (CG), while IFN-γ expression with “+” becomes the majority when the disease develops to gastric cancer (GC). On the contrary, IL-4 expression with “+” decreases gradually when the disease develops from CG to GC, but the rate of IL-4 expression with “+++” increases gradually following the progression; B: Following the progression of gastric lesions, there was no difference of IFN-γ and IL-4 expression in that the former was always with “++”, while the latter was always with “+” in all the groups; C: Following the progression of gastric lesions, IFN-γ expression with “++” were at all dominant, while IL-4 expression with “+” was in the main in all the groups.
Figure 5 Representatives of immunohistochemistry staining for IFN-γ and IL-4 in gastric biopsies of CagA+ H.
pylori (A), CagA- H pylori (B) and those without H pylori infected patients(C) with normal gastric mucosa or with different gastric pathologies (DAB, ×200, Arrowhead shows the representative positive cells, which are stained brown). A1, B1, C1, D1, E1 and F1 represent IFN-γ expression in normal mucosa (NM), chronic gastritis (CG), gastric atrophy (GA), intestinal metaplasia (IM) and gastric cancer (GC), respectively, and A2, B2, C2, D2, E2 and F2 represent IL-4 expression in NM, CG,GA,IM, DP AND GC, respectively. A: The rates of IFN-γ+ cells are great in the CG, GA, and IM groups relative to the DP and GC groups. Additionally, the rates of IL-4+ cells are less in the NC and CG groups, but increased along the progression; B: The rates of IFN-γ+ cells and IL-4+ cells were constant in all the groups, and IFN-γ expression with “++” was dominant, while IL-4 expression with “+” was in the majority of all the groups; C: The rates of IFN-γ+ cells and IL-4+ cells were constant in all the groups, and IFN-γ expression with “++” was dominant, while IL-4 expression with “+” was in the majority of all the groups.
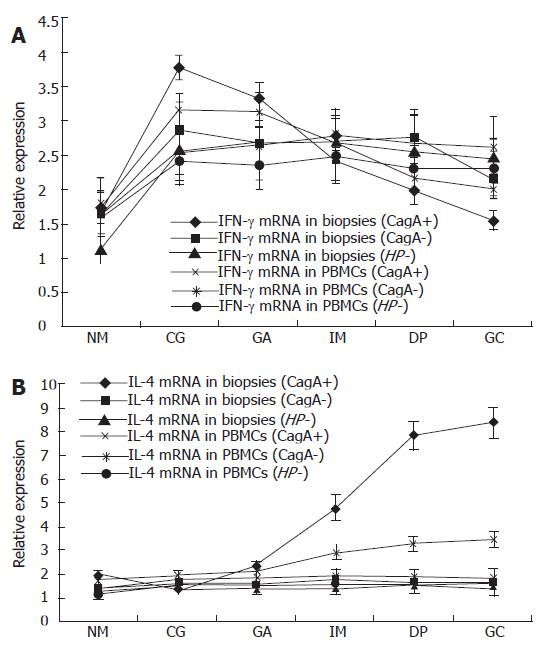
Figure 2 The relative expression of IFN-γ (A) and IL-4 (B) mRNA in peripheral blood mononuclear cells (PBMCs) and gastric biopsies in patients with CagA+ and CagA- H pylori infection and those without H pylori infection as determined by real time RT-PCR.
The relative expression of IFN-γ mRNA decreases from CG to GC, while the relative expression of IL-4 mRNA increases from chronic gastritis (CG) to gastric cancer (GC) in PBMCs and biopsies of CagA+ H pylori infected subjects. However, the magnitudes of relative expression of IFN-γ mRNA and IL-4 mRNA in biopsies are obviously larger than those in PBMCs. There is no difference in the expression of IFN-γ and IL-4 mRNA in PBMCs and local biopsies of subjects with CagA- H pylori infection and of those without H pylori infection.
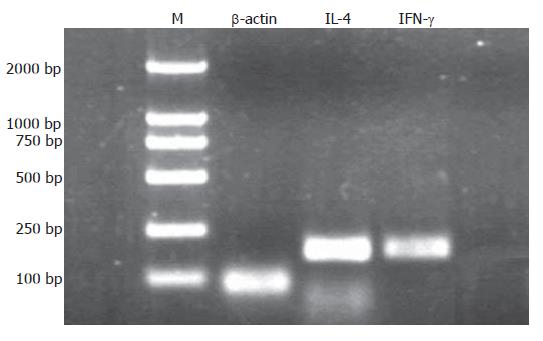
Figure 3 A representative of real time RT-PCR for IFN-γ and IL-4 mRNA expression in PBMCs by agarose gel electrophoresis.
Using the real time PCR products to run agarose gel electrophoresis is to confirm the size of every fragment. M: DNA marker, and the molecular weight of IL-4, IFN-γ and β-actin was 189 bp, 182 bp and 89 bp, respectively.
-
Citation: Wang SK, Zhu HF, He BS, Zhang ZY, Chen ZT, Wang ZZ, Wu GL. CagA+
H pylori infection is associated with polarization of T helper cell immune responses in gastric carcinogenesis. World J Gastroenterol 2007; 13(21): 2923-2931 - URL: https://www.wjgnet.com/1007-9327/full/v13/i21/2923.htm
- DOI: https://dx.doi.org/10.3748/wjg.v13.i21.2923


