Copyright
©2007 Baishideng Publishing Group Co.
World J Gastroenterol. Jun 7, 2007; 13(21): 2923-2931
Published online Jun 7, 2007. doi: 10.3748/wjg.v13.i21.2923
Published online Jun 7, 2007. doi: 10.3748/wjg.v13.i21.2923
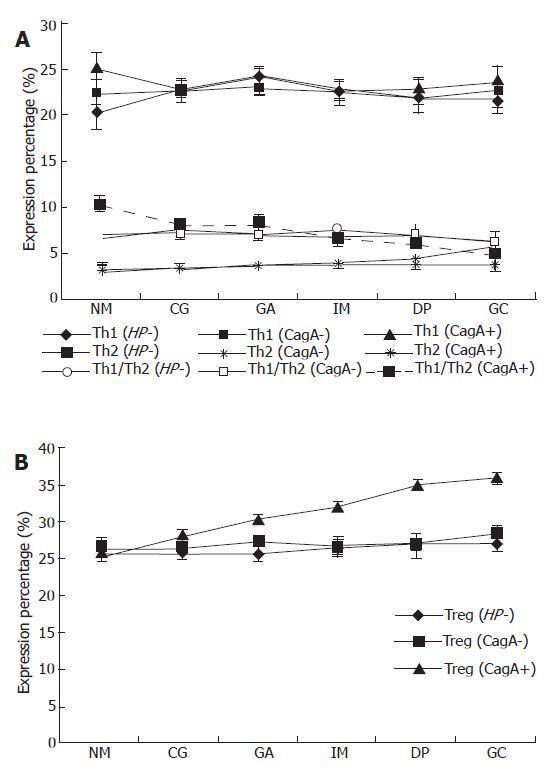
Figure 1 Expression of peripheral blood Th1, Th2 and Th1/Th2 ratio (A) and Treg cells (B) in patients with CagA+ and CagA- H pylori infection and in those without H pylori infection (Hp-) as determined by FCM.
In CagA+ H pylori infected subjects, there is no significant difference in the percentage of Th1 cells in all groups, while the percentage of Th2 cells increases along the progression of gastric pathology, with significant difference between gastric cancer (GC) and chronic gastritis (CG) (P < 0.001), gastric atrophy (GA) (P < 0.001), and intestinal metaplasia (IM) (P < 0.001), respectively. There is a significant difference in the Th1/Th2 ratio between CG and dyspepsia (DP), GC (P = 0.033, P < 0.001), and between GA and GC (P < 0.001) (A). Treg cell expression increases along the progression with significant difference between CG and IM, DP, and GC (P < 0.001, P < 0.001, and P < 0.001, respectively), between GA and DP, and GC (P = 0.002, and P < 0.001, respectively), and between IM and GC (P = 0.012) (B). There is no difference in the expression of Th1, Th2, Treg cells and Th1/Th2 ratio between the subjects with CagA- H pylori infection and those without H pylori infection among all the groups.
-
Citation: Wang SK, Zhu HF, He BS, Zhang ZY, Chen ZT, Wang ZZ, Wu GL. CagA+
H pylori infection is associated with polarization of T helper cell immune responses in gastric carcinogenesis. World J Gastroenterol 2007; 13(21): 2923-2931 - URL: https://www.wjgnet.com/1007-9327/full/v13/i21/2923.htm
- DOI: https://dx.doi.org/10.3748/wjg.v13.i21.2923


