Copyright
©2006 Baishideng Publishing Group Co.
World J Gastroenterol. Feb 21, 2006; 12(7): 1105-1109
Published online Feb 21, 2006. doi: 10.3748/wjg.v12.i7.1105
Published online Feb 21, 2006. doi: 10.3748/wjg.v12.i7.1105
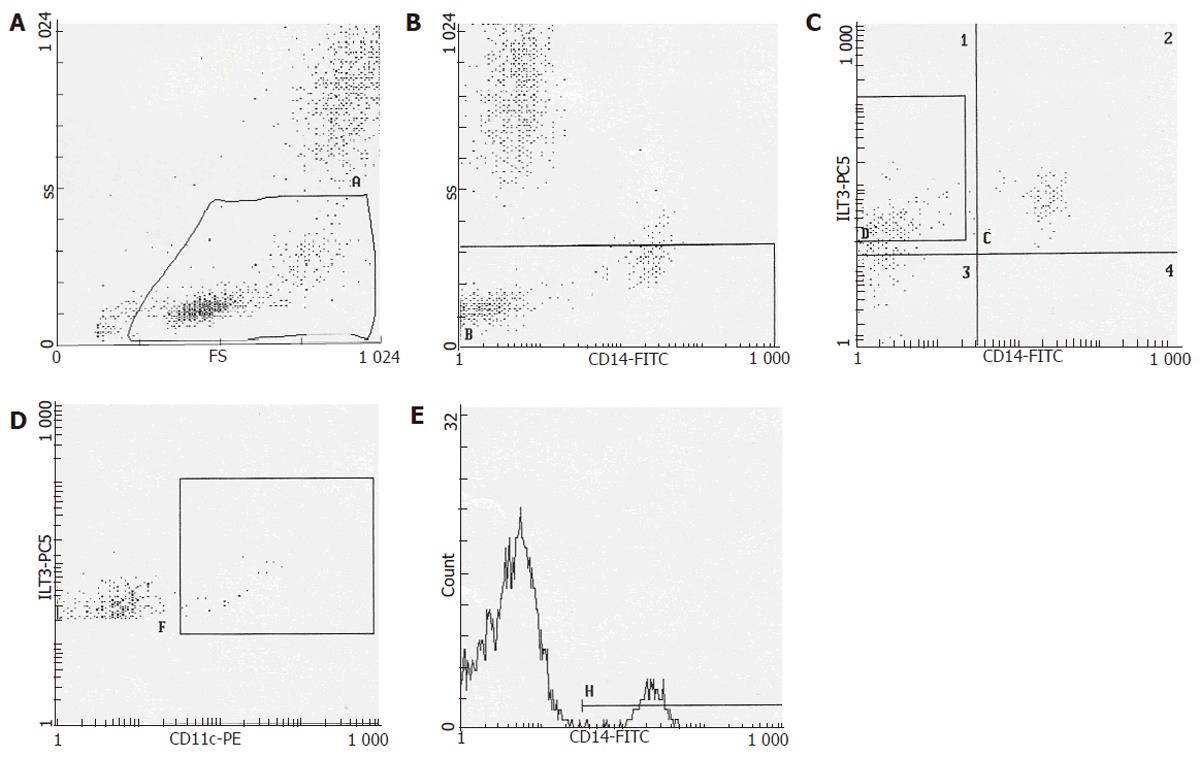
Figure 1 Gate strategies for the mDCs CD11c+ evaluation.
The letter’s order represents the sequential gates used to measure the frequency of mDCs. (A) Side scatter vs forward scatter gate analysis; (B) CD14+ cells analysis vs side scatter to select CD14+ cells avoiding debris; (C) characterization of the cells having high expression of ILT3, as marker of purified myeloid dendritic lineage, on CD14+ subset; (D) evaluation of cells expressing CD11c+, as marker of mature myeloid dendritic cells, on the whole ILT3 gated cells to obtain the mDCs; and (E) histogram of CD14-FITC mAb fluorescence.
Figure 2 Differences in absolute cell count and percentage of mDCs among the examined groups.
The patients having HAV acute infection (AHA) displayed an increase of mDCs as compared to the subjects with acute hepatitis C (AHC) who displayed to have the same frequency as the healthy donor (HD). : Significant differences in absolute cell count (z = -2.37; aP < 0.05) and percentage (z= -2.30; cP < 0.05) (Mann Whitney U test).
- Citation: Perrella A, Atripaldi L, Bellopede P, Patarino T, Sbreglia C, Tarantino G, Sorrentino P, Conca P, Ruggiero L, Perrella O. Flow cytometry assay of myeloid dendritic cells (mDCs) in peripheral blood during acute hepatitis C: Possible pathogenetic mechanisms. World J Gastroenterol 2006; 12(7): 1105-1109
- URL: https://www.wjgnet.com/1007-9327/full/v12/i7/1105.htm
- DOI: https://dx.doi.org/10.3748/wjg.v12.i7.1105


