Copyright
©2006 Baishideng Publishing Group Co.
World J Gastroenterol. Feb 21, 2006; 12(7): 1071-1077
Published online Feb 21, 2006. doi: 10.3748/wjg.v12.i7.1071
Published online Feb 21, 2006. doi: 10.3748/wjg.v12.i7.1071
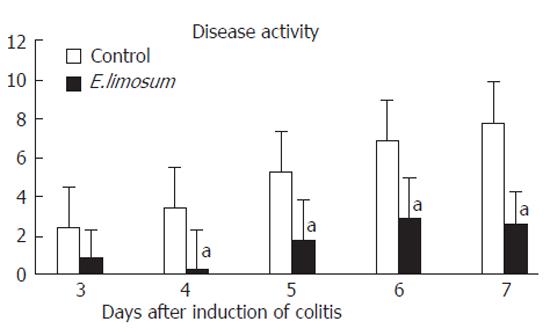
Figure 5 Disease activity index after initiation of dextran sulfate sodium-induced colitis.
Control indicates the control diet (cellulose diet) group. E.limisum indicates the Eubacterium limosum diet group.Data is expressed as means ± SD (n = 7). aP < 0.05 vs control. Disease activity index was determined by scoring changes in body weight, hemoccult positivity, and stool consistency.
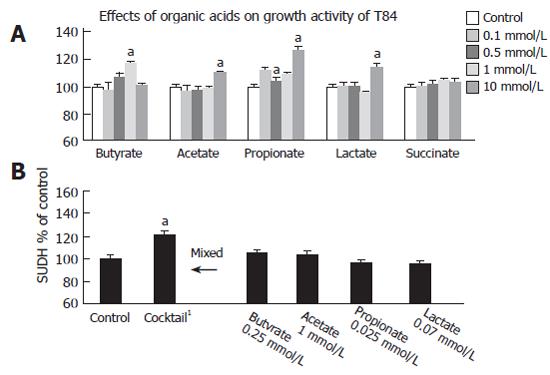
Figure 1 Effect of organic acids (A) and the cocktail mixture of organic acids (B) on SUDH activity in T84 cells.
Cells were incubated with various concentrations of fatty acids for 24 hours. The data is expressed as means ± SD (n = 4). aP < 0.05 vs control. 1The cocktail was an organic acid mixture adjusted to that of 10 % E. limosum supernatant (butyrate [0.25 mmol/L], acetate [1 mmol/L], propionate (0.025 mmol/L), and lactate [0.07 mmol/L]).
Figure 2 Effect of organic acids on secretion of IL-6 by TNF-alpha stimulation in T84 cells.
Cells were incubated with TNF-alpha (50 ng/mL) and various concentrations of organic acids for 24 hours, then supernatant was applied for determination of IL-6 production by ELISA. Data is expressed as means ± SD (n = 3). aP < 0.05 vs control.
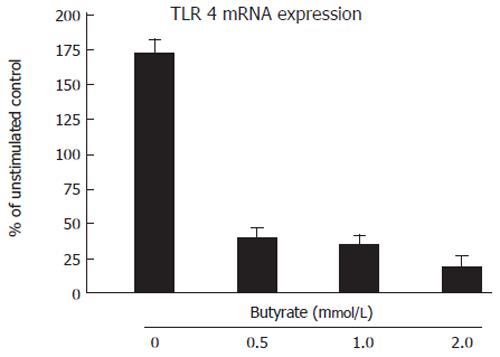
Figure 3 Inhibition of response to TNF -alpha (25 ng/mL) induced the mRNA level of toll-like receptor 4 (TLR4) in T84 by exposure to butyrate.
Cells were treated with 0 to 2.0 mmol/L sodium butyrate for 6 hr prior to extraction of RNA and real time PCR (RT-PCR). RT-PCR was performed with specific primers and probs for indicated receptor components and housekeeping gene beta-actin. All data were normalized to the expression of beta-actin, and presented as % value of control (without TNF-alpha treatment). Data is expressed as means ± SD.
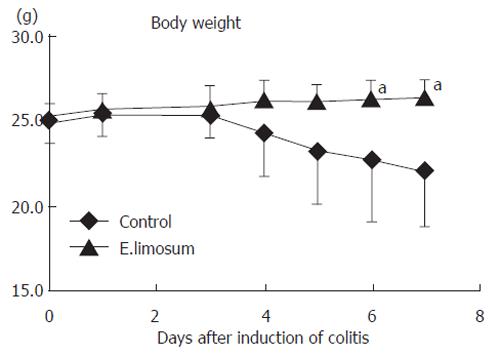
Figure 4 Changes in body weight after initiation of dextran sulfate sodium-induced colitis.
control indicates the control diet (cellulose diet) group. E.limisum indicates the Eubacterium limosum diet group. Data is expressed as means ± SD (n = 7). aP<0.05 vs control.
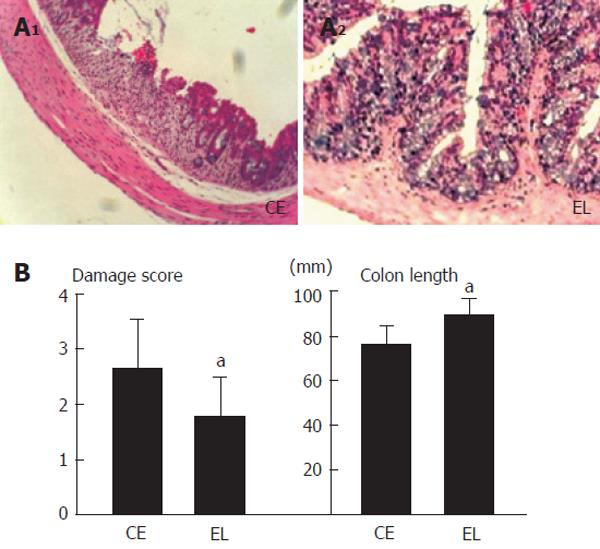
Figure 6 Light histological section of colonic mucosa (A) and changes in colon length and colonic mucosal damage score (B) of dextran sulfate sodium-induced colitis control and E.
limisum diet groups. (magnification X 50). Control indicates the control diet (cellulose diet) group. E.limisum indicates the Eubacterium limosum diet group. Data is expressed as means ± SD (n = 7). aP < 0.05 vs control.
- Citation: Kanauchi O, Fukuda M, Matsumoto Y, Ishii S, Ozawa T, Shimizu M, Mitsuyama K, Andoh A. Eubacterium limosum ameliorates experimental colitis and metabolite of microbe attenuates colonic inflammatory action with increase of mucosal integrity. World J Gastroenterol 2006; 12(7): 1071-1077
- URL: https://www.wjgnet.com/1007-9327/full/v12/i7/1071.htm
- DOI: https://dx.doi.org/10.3748/wjg.v12.i7.1071


