Copyright
©2006 Baishideng Publishing Group Co.
World J Gastroenterol. Feb 21, 2006; 12(7): 1071-1077
Published online Feb 21, 2006. doi: 10.3748/wjg.v12.i7.1071
Published online Feb 21, 2006. doi: 10.3748/wjg.v12.i7.1071
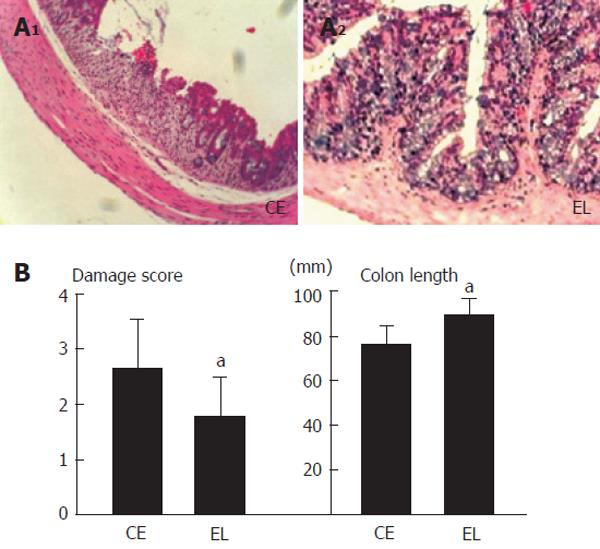
Figure 6 Light histological section of colonic mucosa (A) and changes in colon length and colonic mucosal damage score (B) of dextran sulfate sodium-induced colitis control and E.
limisum diet groups. (magnification X 50). Control indicates the control diet (cellulose diet) group. E.limisum indicates the Eubacterium limosum diet group. Data is expressed as means ± SD (n = 7). aP < 0.05 vs control.
- Citation: Kanauchi O, Fukuda M, Matsumoto Y, Ishii S, Ozawa T, Shimizu M, Mitsuyama K, Andoh A. Eubacterium limosum ameliorates experimental colitis and metabolite of microbe attenuates colonic inflammatory action with increase of mucosal integrity. World J Gastroenterol 2006; 12(7): 1071-1077
- URL: https://www.wjgnet.com/1007-9327/full/v12/i7/1071.htm
- DOI: https://dx.doi.org/10.3748/wjg.v12.i7.1071


