Copyright
©2006 Baishideng Publishing Group Co.
World J Gastroenterol. Feb 14, 2006; 12(6): 915-920
Published online Feb 14, 2006. doi: 10.3748/wjg.v12.i6.915
Published online Feb 14, 2006. doi: 10.3748/wjg.v12.i6.915
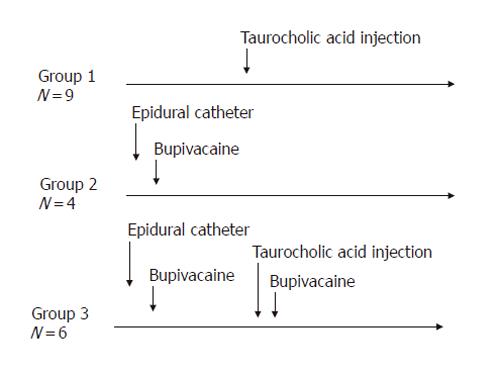
Figure 1 Experimental design.
Acute pancreatitis was induced in Groups 1 and 3 by injection of taurocholic acid (5%, 500 µL) into the biliopancreatic duct. Epidural anesthesia was induced in Groups 2 and 3 by epidural injection of bupivacaine
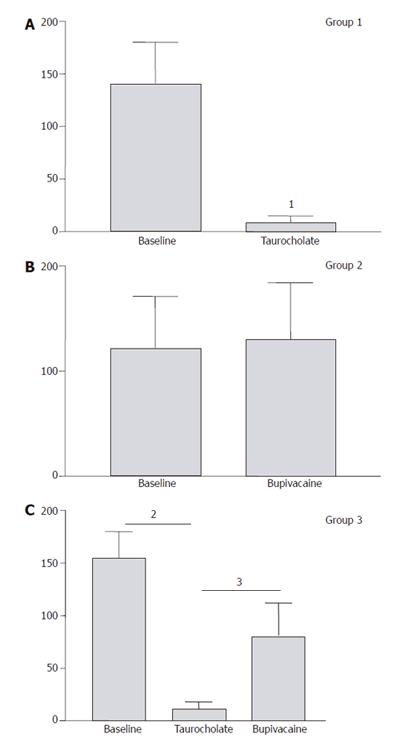
Figure 2 Pancreatic microcirculatory blood flow (arbitrary units).
In Group 1, the mean value of pancreatic blood flow measured prior to and after induction of AP showed a significant decrease of perfusion from 141 ± 40 units to 9 ± 6 units (96%) (1P = 0.008) within 30 min. In Group 2, the mean value of pancreatic blood flow measured prior to and after induction of epidural anaesthesia showed no significant modification of perfusion. In Group 3, mean value of pancreatic blood flow measured prior to and after induction of AP, and epidural anaesthesia, respectively. Induction of AP caused a significant decrease in pancreatic microcirculatory flow from 155 ± 25 units to 11 ± 7 units (93%) (2P = 0.004). After induction of epidural anesthesia, mean pancreatic microcirculatory blood flow increased again significantly to 81 ± 31 units within 45 min, reaching 52% of base line values (3P = 0.028).
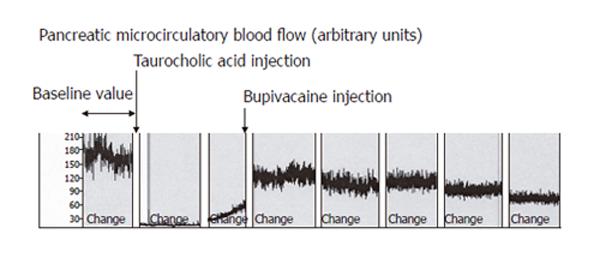
Figure 3 Recording of pancreatic microcirculatory blood flow in Group 3.
Rats were injected with taurocholic acid and treated 30 min later with bupivacaine (0.4%, 20 µL) in the epidural catheter. Induction of AP caused a significant decrease in pancreatic microcirculatory blood flow. After induction of epidural anesthesia, mean pancreatic microcirculatory blood flow increased again significantly within 45 min, reaching approximately 50% of baseline values.
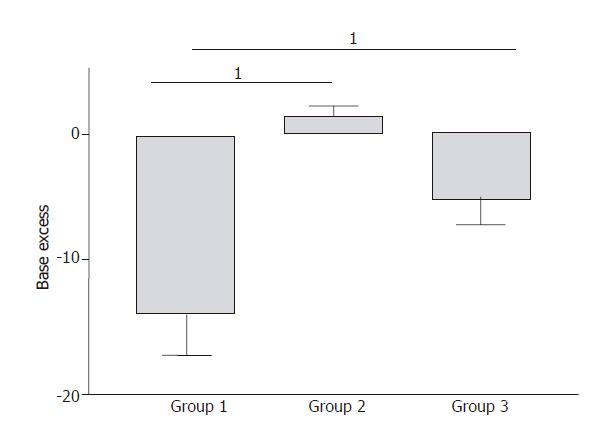
Figure 4 Arterial blood gas analyses.
In Group 1, severe metabolic acidosis developed progressively reaching a maximum base excess (BE) value of -14 ± 3 mmol/L at the end of the experiment. In Group 2, BE values remained unchanged compared to baseline values. In Group 3, a mild metabolic acidosis developed reaching a maximum BE value of -6 ± 4 mmol/L at the end of the experiment. This result was significantly improved compared to Group 1 (1P = 0.007).
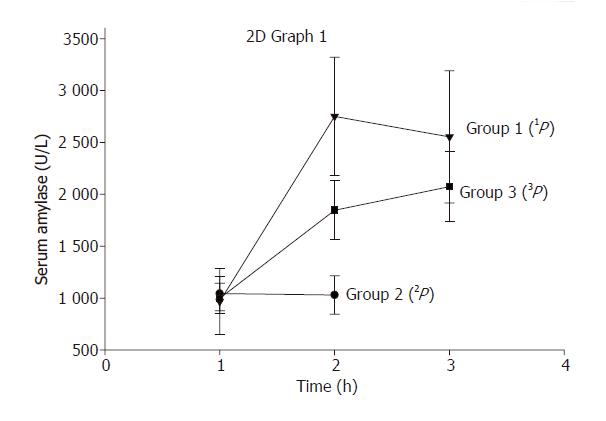
Figure 5 Serum amylase levels.
In Group 1, serum amylase levels increased from 694 ± units/L 419 prior to AP to 2178 ± 561 units/L (1P < 0.05, vs serum amylase levels before induction of AP) after 2 h of induction of AP. In Group 2, epidural anaesthesia did not modify serum amylase levels significantly (P = 0.9). In Group 3, serum amylase levels increased to a maximum of 1829±641 units/L after 2 h of initiation of AP and epidural anesthesia. Although this result was lower compared to Group 1, but did not reach statistical significance (3P = 0.08).
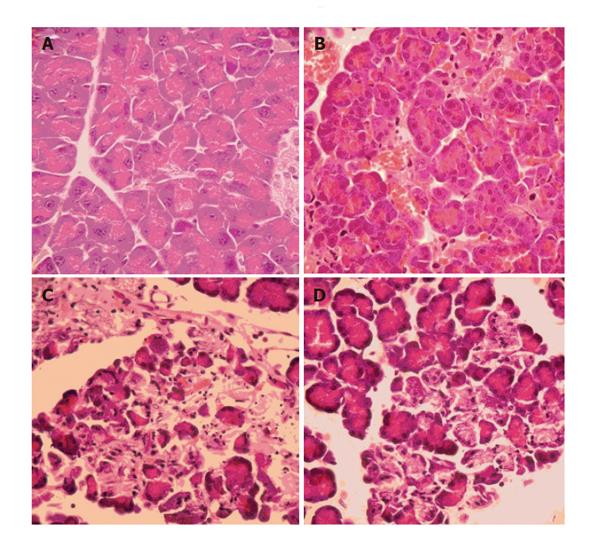
Figure 6 Histopathological features of pancreatic tissue.
A: A control animal was sacrificed and histopathology showed normal pancreas; B: Group 2 animals showing normal pancreatic tissue with minor modifications, possibly related to vasodilatation and surgical manipulations; C: Group 1 animals showing a severe form of AP with extensive edema and tissue necrosis; and D: Group 3 animals demonstrating less extensive pancreatic edema and necrosis compared to Group 1 animals.
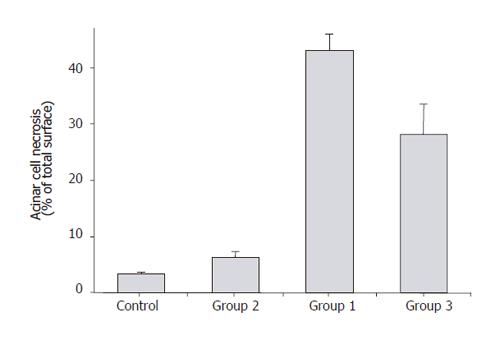
Figure 7 Acinar cell necrosis (percentage of total pancreatic surface).
The measure of acinar cell necrosis by percentage of total surface at high power field (HPF) showed that Group 2 animals had similar cell necrosis as the controls (<10%). Group 1 animals demonstrated over 40% acinar cell necrosis at HPF, whereas acinar cell necrosis was below 30% in Group 3 animals.
- Citation: Demirag A, Pastor CM, Morel P, Jean-Christophe C, Sielenkämper AW, Güvener N, Mai G, Berney T, Frossard JL, Bühler LH. Epidural anaesthesia restores pancreatic microcirculation and decreases the severity of acute pancreatitis. World J Gastroenterol 2006; 12(6): 915-920
- URL: https://www.wjgnet.com/1007-9327/full/v12/i6/915.htm
- DOI: https://dx.doi.org/10.3748/wjg.v12.i6.915


