Copyright
©2006 Baishideng Publishing Group Co.
World J Gastroenterol. Feb 14, 2006; 12(6): 915-920
Published online Feb 14, 2006. doi: 10.3748/wjg.v12.i6.915
Published online Feb 14, 2006. doi: 10.3748/wjg.v12.i6.915
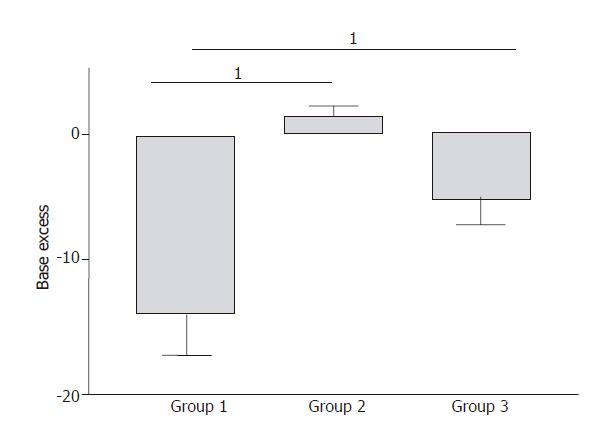
Figure 4 Arterial blood gas analyses.
In Group 1, severe metabolic acidosis developed progressively reaching a maximum base excess (BE) value of -14 ± 3 mmol/L at the end of the experiment. In Group 2, BE values remained unchanged compared to baseline values. In Group 3, a mild metabolic acidosis developed reaching a maximum BE value of -6 ± 4 mmol/L at the end of the experiment. This result was significantly improved compared to Group 1 (1P = 0.007).
- Citation: Demirag A, Pastor CM, Morel P, Jean-Christophe C, Sielenkämper AW, Güvener N, Mai G, Berney T, Frossard JL, Bühler LH. Epidural anaesthesia restores pancreatic microcirculation and decreases the severity of acute pancreatitis. World J Gastroenterol 2006; 12(6): 915-920
- URL: https://www.wjgnet.com/1007-9327/full/v12/i6/915.htm
- DOI: https://dx.doi.org/10.3748/wjg.v12.i6.915


