Copyright
©2006 Baishideng Publishing Group Co.
World J Gastroenterol. Dec 21, 2006; 12(47): 7613-7620
Published online Dec 21, 2006. doi: 10.3748/wjg.v12.i47.7613
Published online Dec 21, 2006. doi: 10.3748/wjg.v12.i47.7613
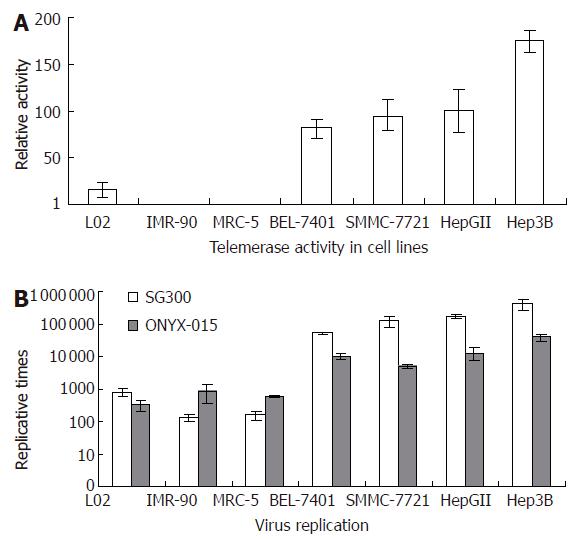
Figure 1 Relationship between telomerase activity of the cell lines and replicative capability of SG300.
By telomeric repeat amplification protocol (TRAP) and ELISA assay (A), every cancer cell line was positive for telomerase activity, but the normal fibroblast cell lines were not, whereas the hepatocellular line L02 showed weak telomerase activity. By TCID50 method (B), SG300 replicated selectively in cancer cells but rarely in normal cells (P = 0.0453). The replicative capability of SG300 was coincident with the telomerase activity in various cell lines.
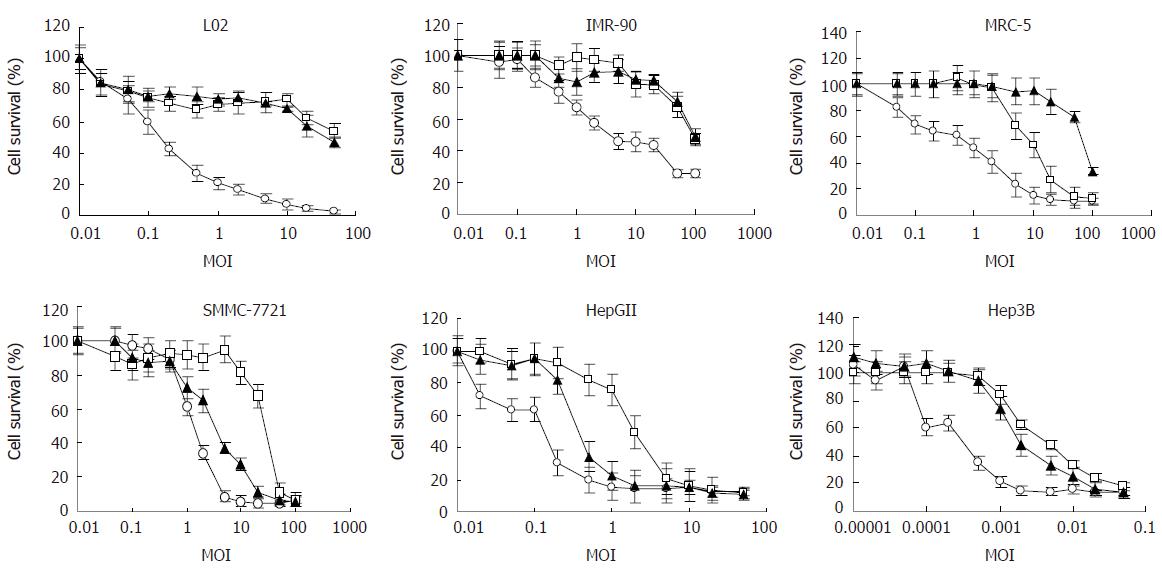
Figure 2 Selective oncolytic effect of SG300 on HCC cell lines.
At MOI = 10, the cell viability was < 30% in HCC cells, but > 68% in normal cells when infected with SG300. The oncolytic effect of SG300 was stronger on HCC cells and weaker on normal cells than that of ONYX-015, being close to that of WAd5. The killing effect of SG300 and ONYX-015 on normal cells became apparent when MOI = 100. —▲—SG300, —□—ONYX-015, —◆—WAd5.
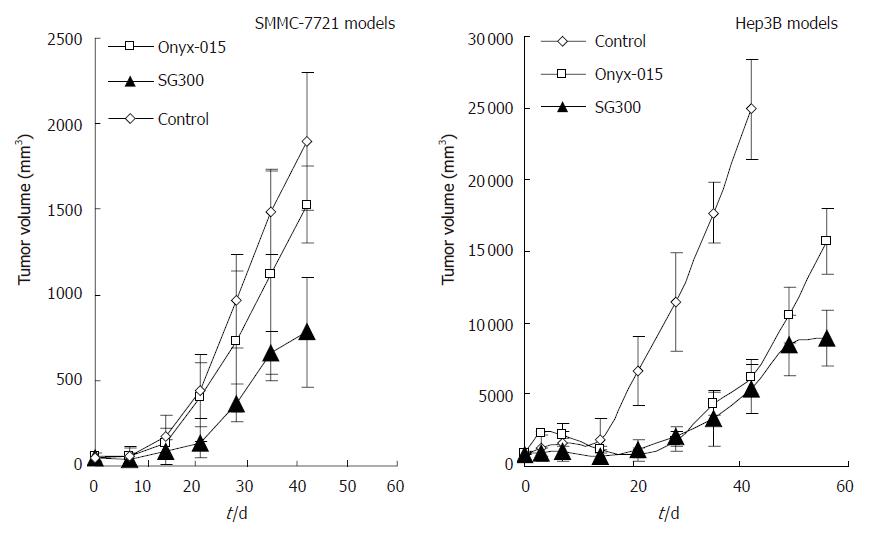
Figure 3 Antitumor activity of SG300 on HCC xenografts in nude mice.
In SMMC-7721 and Hep3B models, efficient antitumor activities were found in groups treated with SG300 when compared with control group on d 42 (P < 0.05). The antitumor effect of SG300 was better than that of ONYX-015. WAd5 group in SMMC-7721 models also showed efficient antitumor efficacy, however, 5 of 10 mice died during the period of observation.
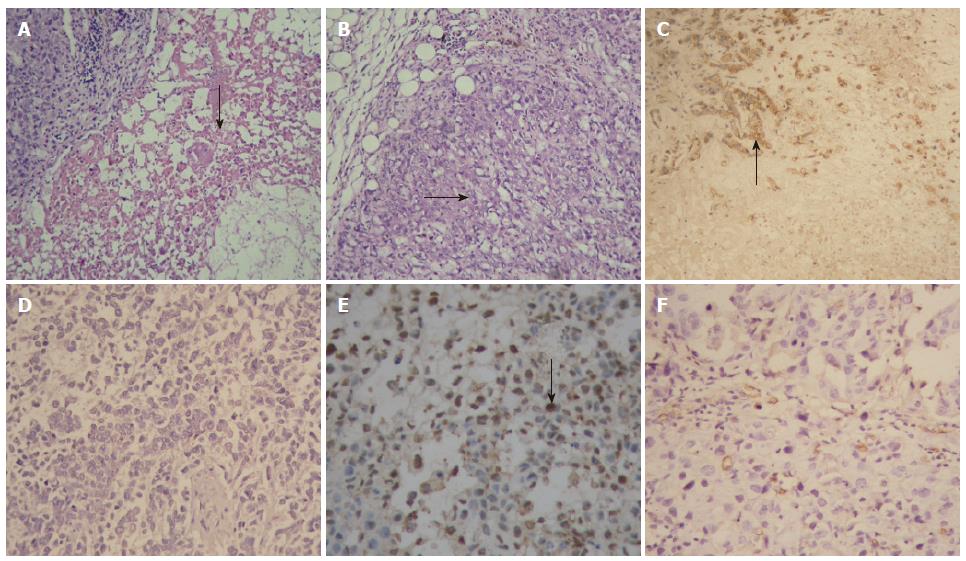
Figure 4 Pathological examination of tumor specimens (× 200).
HE staining showed wide areas of necrosis (arrow) in tumor tissues of the SG300-treated group (A), but cancer cells grew luxuriantly (arrow) in the control group (B). Immunohistochemistry demonstrated that most cancer cells around the necrotic area were positive for adenoviral capsid protein hexon (arrow) in the SG300-treated group (C), but cancer cells were negative for hexon in the control group (D). More cancer cells were positive for TUNEL labeling (arrow) in tumor tissues of the SG300-treated group (E), whereas only a few cancer cells were positive for TUNEL labeling in the control group (F).
- Citation: Su CQ, Wang XH, Chen J, Liu YJ, Wang WG, Li LF, Wu MC, Qian QJ. Antitumor activity of an hTERT promoter-regulated tumor-selective oncolytic adenovirus in human hepatocellular carcinoma. World J Gastroenterol 2006; 12(47): 7613-7620
- URL: https://www.wjgnet.com/1007-9327/full/v12/i47/7613.htm
- DOI: https://dx.doi.org/10.3748/wjg.v12.i47.7613


