Copyright
©2006 Baishideng Publishing Group Co.
World J Gastroenterol. Dec 7, 2006; 12(45): 7250-7262
Published online Dec 7, 2006. doi: 10.3748/wjg.v12.i45.7250
Published online Dec 7, 2006. doi: 10.3748/wjg.v12.i45.7250
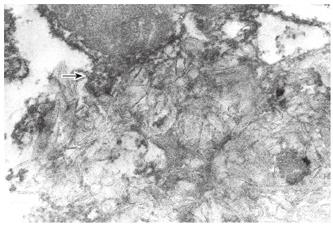
Figure 1 Hepatocytic ultrastructure.
Digitonin-treated biopsy specimen. The specimen is contrasted with aqueous uranyl acetate and lead citrate. Deposits of cholesterol-digitonin complexes (the view of “tender spoondrift clouds”) are seen in the cytoplasm close to the mitochondria. The mitochondrial membrane forms pseudopodia here and there (indicated by arrow).
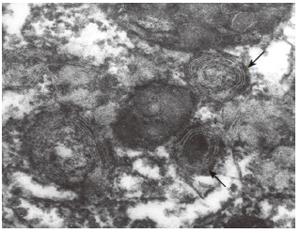
Figure 2 Hepatocytic ultrastructure in PBC.
Biopsy specimen. The specimen is contras-ted with aqueous uranyl acetate and lead citrate. Arrows indicate myelin-like and multilamellar structures with increased osmiophi-lia.
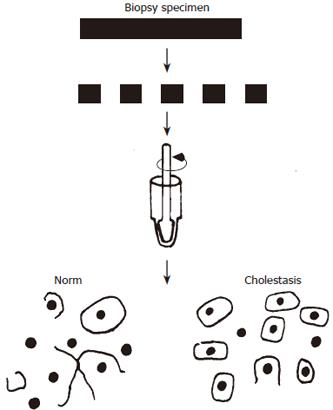
Figure 3 The scheme of liver biopsy specimen homogenization for quantitative adhesiometric study.
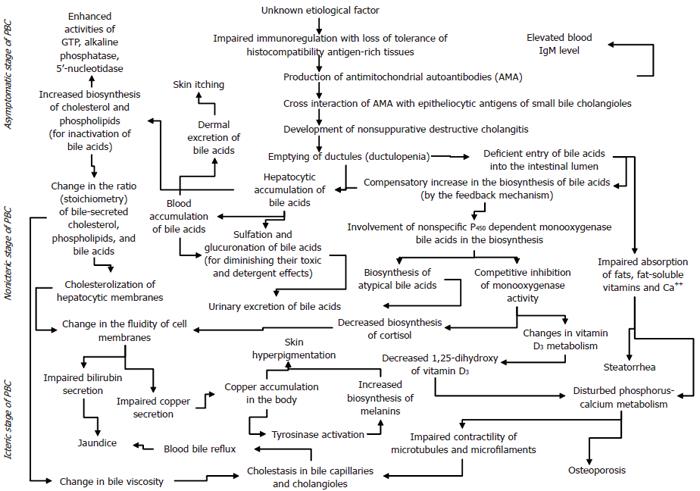
Figure 4 The scheme of mechanisms responsible for triggering and developing the major signs of PBC.
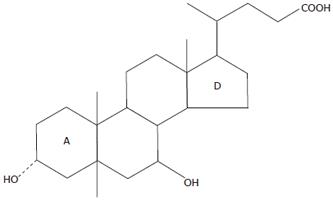
Figure 5 Ursodeoxycholic acid.
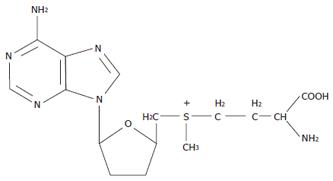
Figure 6 S-adenosyl-L-methionine.
- Citation: Reshetnyak VI. Concept on the pathogenesis and treatment of primary biliary cirrhosis. World J Gastroenterol 2006; 12(45): 7250-7262
- URL: https://www.wjgnet.com/1007-9327/full/v12/i45/7250.htm
- DOI: https://dx.doi.org/10.3748/wjg.v12.i45.7250


