Copyright
©2006 Baishideng Publishing Group Co.
World J Gastroenterol. Nov 7, 2006; 12(41): 6689-6692
Published online Nov 7, 2006. doi: 10.3748/wjg.v12.i41.6689
Published online Nov 7, 2006. doi: 10.3748/wjg.v12.i41.6689
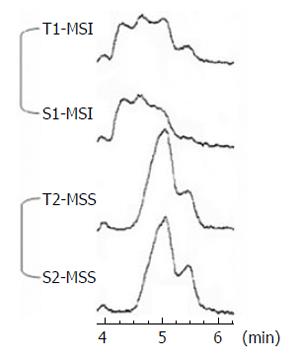
Figure 1 MSI analysis in BAT 26 using DHPLC.
Chromatograms of four different DNA samples are shown. T2-S2 displayed MSS, while T1-S1 exhibited MSI in both colorectal cancer tissue and stool DNA. T, DNA from colorectal cancer tissue: S, DNA from stool: MSI, microsatellite instability; MSS, microsatellite stability.
- Citation: Lim SB, Jeong SY, Kim IJ, Kim DY, Jung KH, Chang HJ, Choi HS, Sohn DK, Kang HC, Shin Y, Jang SG, Park JH, Park JG. Analysis of microsatellite instability in stool DNA of patients with colorectal cancer using denaturing high performance liquid chromatography. World J Gastroenterol 2006; 12(41): 6689-6692
- URL: https://www.wjgnet.com/1007-9327/full/v12/i41/6689.htm
- DOI: https://dx.doi.org/10.3748/wjg.v12.i41.6689


