Copyright
©2006 Baishideng Publishing Group Co.
World J Gastroenterol. Oct 14, 2006; 12(38): 6239-6243
Published online Oct 14, 2006. doi: 10.3748/wjg.v12.i38.6239
Published online Oct 14, 2006. doi: 10.3748/wjg.v12.i38.6239
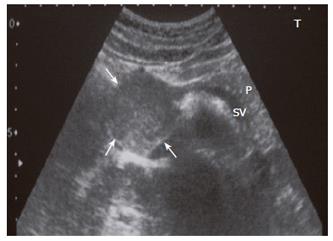
Figure 1 A hypoechogenic well-marginated solid mass is seen at the pancreatic head region (arrows).
Vena cava inferior is slightly compressed by the mass. SV: Splenic vein; P: Pancreatic tail.
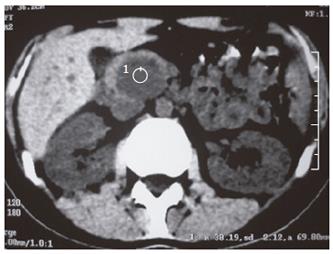
Figure 2 Axial precontrast CT image shows that the mass is hypodense with no evidence of calcification.
The density of the mass is measured 38.19 HU.
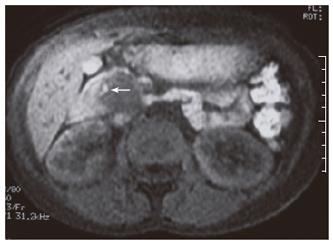
Figure 3 Precontast T1-weighted axial MR image shows that the mass is predominantly hypointense and the hyperintense focus represents hemorrhage (arrow).
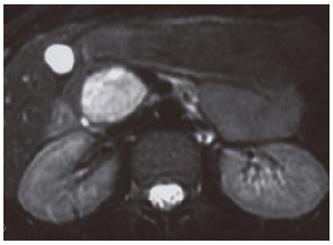
Figure 4 T2-weighted axial MR image shows that the mass is predominantly hyperintense mostly composing of solid compounds and minimal cystic areas.
Figure 5 A: Arterial-phase contrast-enhanced T1-weighted image shows minimal peripheral thin contrast enhancement (arrow); B, C: Portal venous and equilibrium-phase contrast-enhanced T1-weighted images show that the mass enhances diffusely slightly.
Figure 6 A: Pancreatic tissue is seen around the tumor including papillary structures and hemorrhagic areas (HE × 40); B: Solid pseudopapillary tumor.
Pseudopapillary aggregates lined by tumor cells with uniform nucleus and narrow eosinophilic cytoplasms are visible (HE × 40); C: Micrograph shows progesterone receptor positivity in the nucleus of tumor cells (× 100).
- Citation: Karatag O, Yenice G, Ozkurt H, Basak M, Basaran C, Yilmaz B. A case of solid pseudopapillary tumor of the pancreas. World J Gastroenterol 2006; 12(38): 6239-6243
- URL: https://www.wjgnet.com/1007-9327/full/v12/i38/6239.htm
- DOI: https://dx.doi.org/10.3748/wjg.v12.i38.6239


