Copyright
©2006 Baishideng Publishing Group Co.
World J Gastroenterol. Oct 7, 2006; 12(37): 5978-5986
Published online Oct 7, 2006. doi: 10.3748/wjg.v12.i37.5978
Published online Oct 7, 2006. doi: 10.3748/wjg.v12.i37.5978
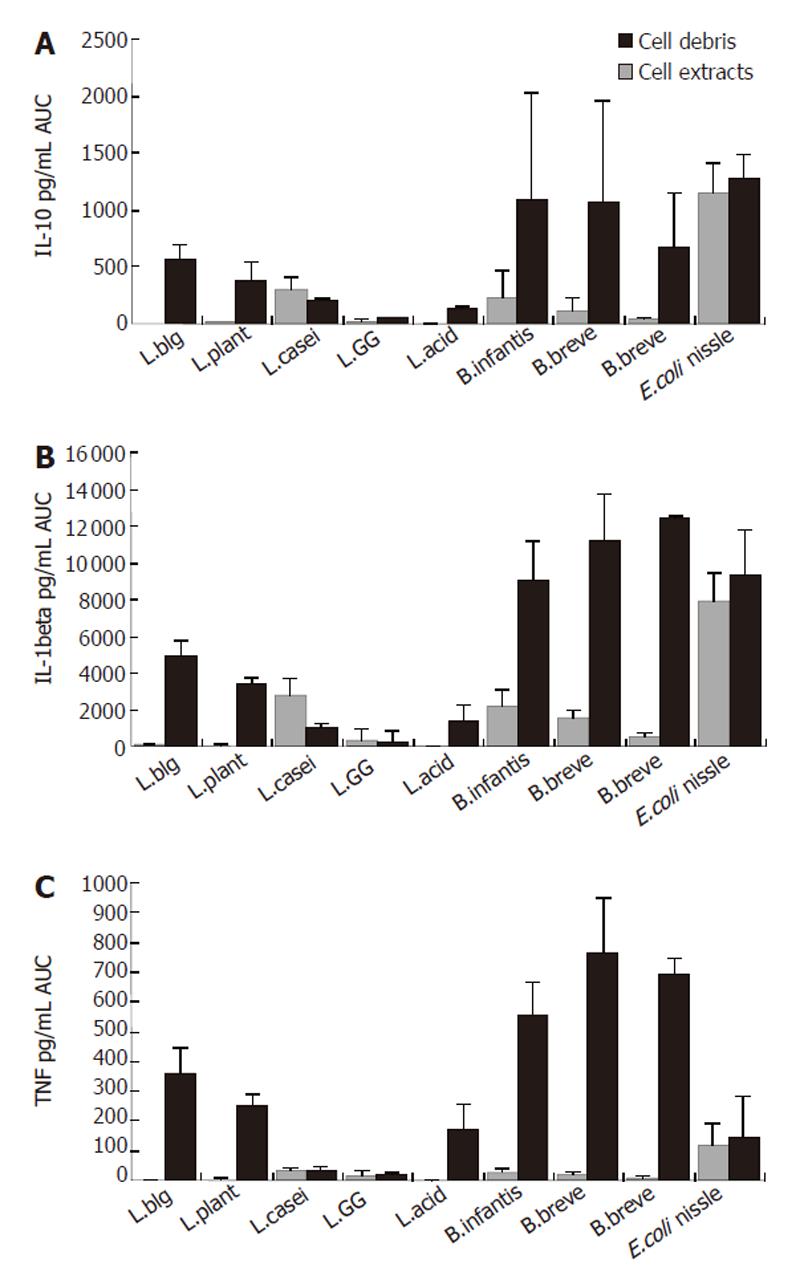
Figure 1 Concentration of IL-10 (A), IL-1β (B) and TNFα (C) by PBMNC (area under the curve of mean ± SE) after incubation with cell debris (■) or cell extract (□) of different strains.
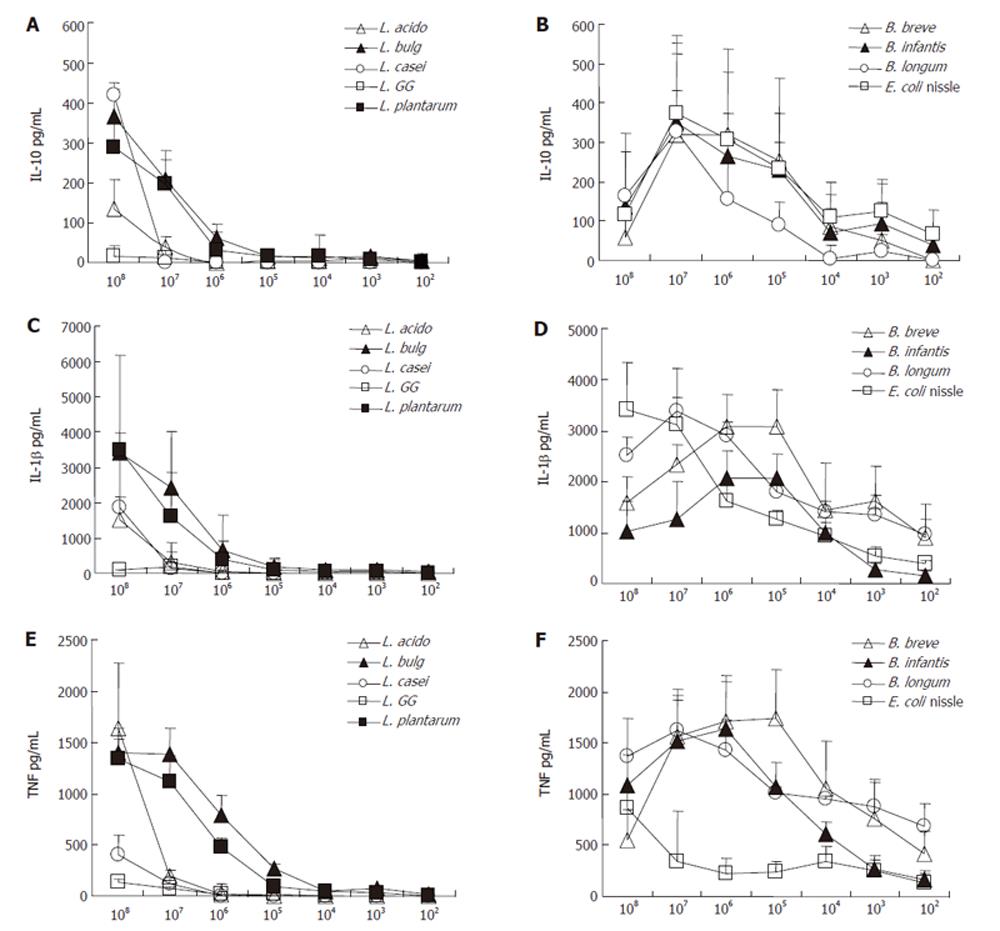
Figure 2 Cytokine concentration of supernatant after incubation of PBMNC with cell debris of bacteria in different concentrations.
A and B: supernatant concentration of IL-10 in pg/ml (mean ± SE); C and D: supernatant concentration of IL1β in pg/ml (mean ± SE); E and F: supernatant concentration of TNFα in pg/mL (mean ± SE). Lactobacilli are described on the left side and bifidobacteria are described on the right side.
Figure 3 Cytokine concentrations of supernatant after incubation of PBMNC with cell debris (left side) or cell extracts (right side) of bacteria from different species families in different concentrations.
A and B: supernatant concentration of IL-10 in pg/ml (mean ± SE); C and D: supernatant concentration of IL1β in pg/ml (mean ± SE); E and F: supernatant concentration of TNFα in pg/mL (mean ± SE).
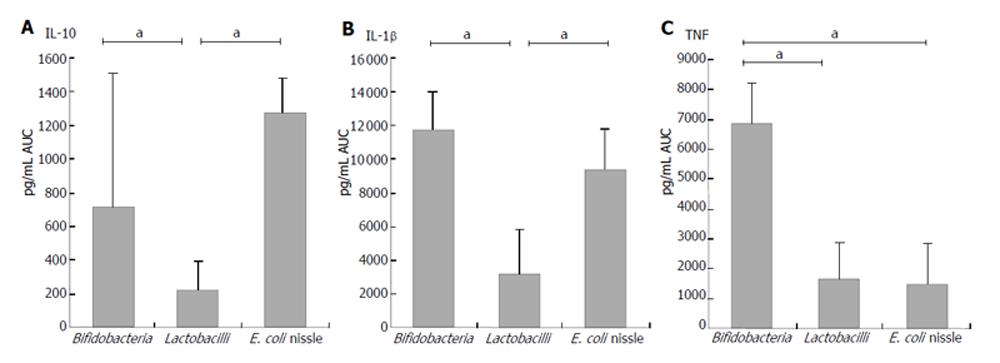
Figure 4 Supernatant concentrations of different cytokines after co-incubation of PBMNC with cell debris of bacteria from different species families.
With regard to lactobacilli results are pooled from L.acidophilus, L.bulgaricus, L.casei, L.GG, L.plantarum. With regard to bifidobacteria results are pooled from B.breve, B.infantis, B.longum. IL-10, IL-1β and TNFα shown as area under the curve (mean ± SE) ( aP < 0.05 ).
- Citation: Helwig U, Lammers KM, Rizzello F, Brigidi P, Rohleder V, Caramelli E, Gionchetti P, Schrezenmeir J, Foelsch UR, Schreiber S, Campieri M. Lactobacilli, bifidobacteria and E. coli nissle induce pro- and anti-inflammatory cytokines in peripheral blood mononuclear cells. World J Gastroenterol 2006; 12(37): 5978-5986
- URL: https://www.wjgnet.com/1007-9327/full/v12/i37/5978.htm
- DOI: https://dx.doi.org/10.3748/wjg.v12.i37.5978


