Copyright
©2006 Baishideng Publishing Group Co.
World J Gastroenterol. Aug 7, 2006; 12(29): 4727-4735
Published online Aug 7, 2006. doi: 10.3748/wjg.v12.i29.4727
Published online Aug 7, 2006. doi: 10.3748/wjg.v12.i29.4727
Figure 1 Immunization schedule of pHBc144 and pIL-15 plasmid.
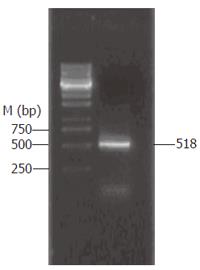
Figure 2 Electrophoretogram of PCR products.
The human IL-15 coding sequence (GenBank U14407) was RT-PCR amplified from human PBL mRNA stimulated with LPS.
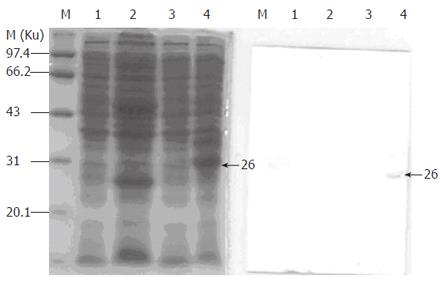
Figure 3 SDS-PAGE and Western blotting of recombinant polypeptides.
M: polypeptide molecular marker; lane 1: BL21; lane 2: pET32c ; lane 3: pET-15 uninduced ; lane 4: pET-15 induced.
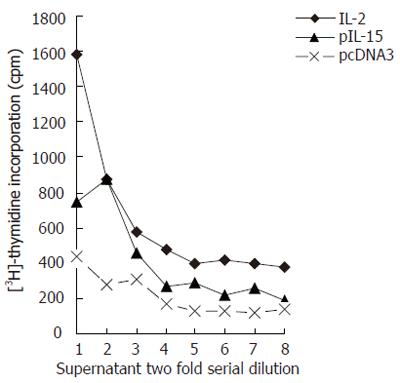
Figure 4 IL-15 bioactivity in supernatants of cells transfected with pIL-15 expression plasmid.
COS cells were transfected with pIL-15 (▲) expression constructs or vector pcDNA3 (×), and the supernatants were collected 72 h after transfection. The supernatants were tested by CTLL-2 bioassay to measure IL-15 bioactivity. IL-2 (5 × 10³ U/ mL) was used as a positive control.
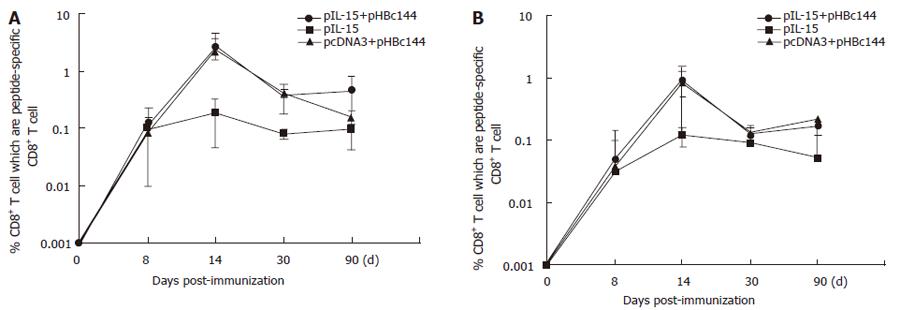
Figure 5 Kinetics of antigen-specific CD8+ T-cell response in spleen (A) and PBMCs (B) following DNA immunization.
Mice were immunized with pHBc144 plasmid DNA or vector DNA intramuscularly. At various time points, splenocytes and PBMCs were harvested, stimulated for 5 h with specific peptide, double stained with anti-CD8a-PE and anti-IFN-γ-APC. A total of 1 × 10⁵ events were acquired by a flow cytometer. The indicated values on the lines of the figure (plotted on a log10 scale) reflect the percentage of peptide-specific CD8+ T-cells to total CD8+ T-cells in the spleens or PBMCs (about three mice/group at each time point). The cut-off value was 0.1%.
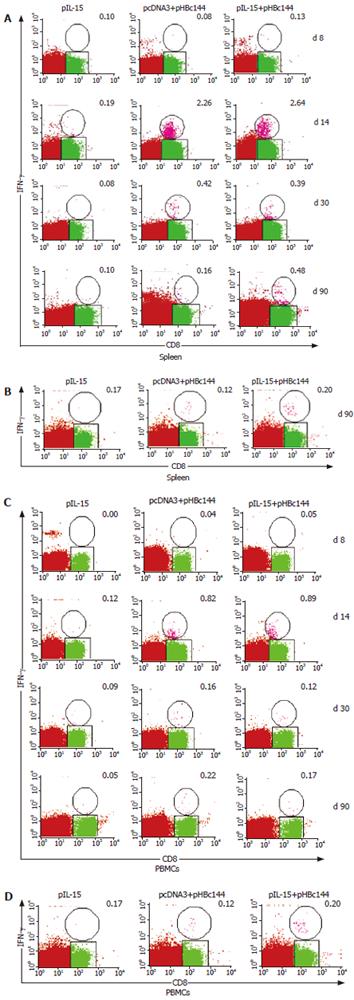
Figure 6 Percentages of HBc specific CD8+ T cells in the spleen after primary (A) and secondary immunization (B) and in PBMCs after primary (C) and secondary immunization (D) detected by ICCs directly ex vivo at various time points.
C57BL/6 mice were immunized with pHBc144 DNA or pIL-15 DNA and boosted at d 30 later. The splenocytes and harvested at various time points. Then the cells were cultured for 5 h in the absence or presence of the HBcAg peptide and double stained with anti-CD8a-PE and anti-IFN-γ-APC. CD8+IFN-γ+cells are enclosed in ovals, and the numbers in the upper right quadrants represent the percentage of CD8+IFN-γ+ cells to total CD8+ T cells. The data from each group at each time point represent mean ± SD (n = 3). Naïve mice were used as negative controls. The cut-off value was 0.1%.
- Citation: Zhang W, Dong SF, Sun SH, Wang Y, Li GD, Qu D. Coimmunization with IL-15 plasmid enhances the longevity of CD8 T cells induced by DNA encoding hepatitis B virus core antigen. World J Gastroenterol 2006; 12(29): 4727-4735
- URL: https://www.wjgnet.com/1007-9327/full/v12/i29/4727.htm
- DOI: https://dx.doi.org/10.3748/wjg.v12.i29.4727


