Copyright
©2006 Baishideng Publishing Group Co.
World J Gastroenterol. Aug 7, 2006; 12(29): 4727-4735
Published online Aug 7, 2006. doi: 10.3748/wjg.v12.i29.4727
Published online Aug 7, 2006. doi: 10.3748/wjg.v12.i29.4727
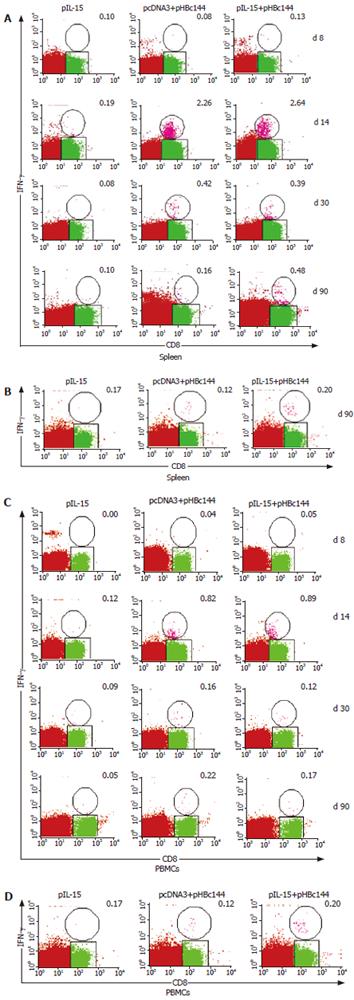
Figure 6 Percentages of HBc specific CD8+ T cells in the spleen after primary (A) and secondary immunization (B) and in PBMCs after primary (C) and secondary immunization (D) detected by ICCs directly ex vivo at various time points.
C57BL/6 mice were immunized with pHBc144 DNA or pIL-15 DNA and boosted at d 30 later. The splenocytes and harvested at various time points. Then the cells were cultured for 5 h in the absence or presence of the HBcAg peptide and double stained with anti-CD8a-PE and anti-IFN-γ-APC. CD8+IFN-γ+cells are enclosed in ovals, and the numbers in the upper right quadrants represent the percentage of CD8+IFN-γ+ cells to total CD8+ T cells. The data from each group at each time point represent mean ± SD (n = 3). Naïve mice were used as negative controls. The cut-off value was 0.1%.
- Citation: Zhang W, Dong SF, Sun SH, Wang Y, Li GD, Qu D. Coimmunization with IL-15 plasmid enhances the longevity of CD8 T cells induced by DNA encoding hepatitis B virus core antigen. World J Gastroenterol 2006; 12(29): 4727-4735
- URL: https://www.wjgnet.com/1007-9327/full/v12/i29/4727.htm
- DOI: https://dx.doi.org/10.3748/wjg.v12.i29.4727


